Copyright
©The Author(s) 2025.
World J Psychiatry. Sep 19, 2025; 15(9): 110352
Published online Sep 19, 2025. doi: 10.5498/wjp.v15.i9.110352
Published online Sep 19, 2025. doi: 10.5498/wjp.v15.i9.110352
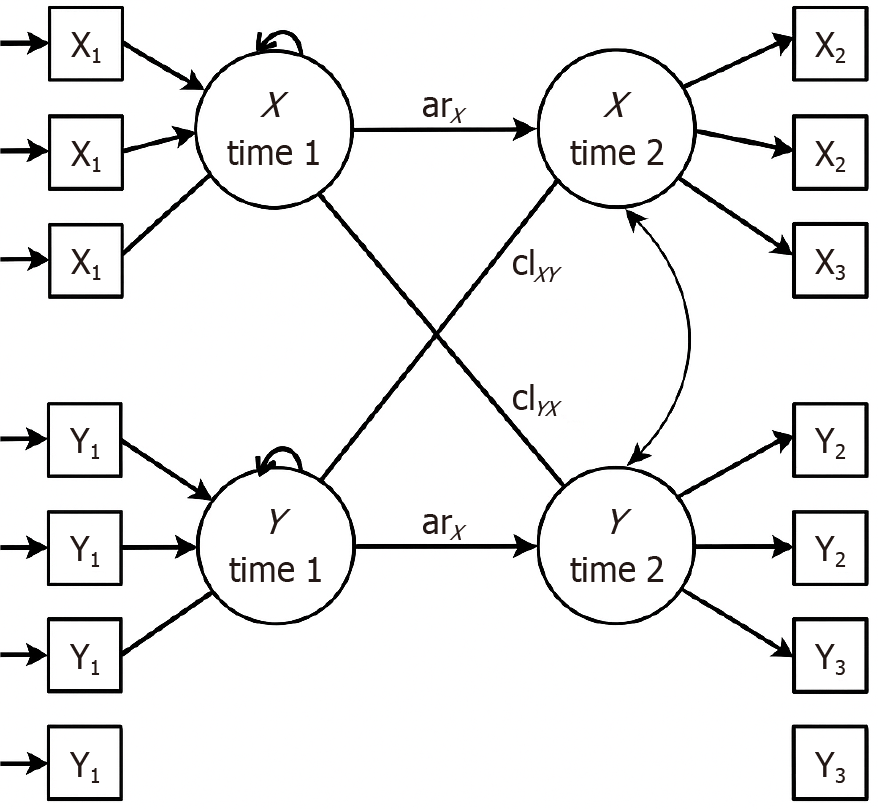
Figure 1 Concept of cross-lagged panel network analysis.
The variables within the circles are linked by autoregressive paths (arX) from time 1 to time 2, as well as cross-lagged paths (clXY, clYX) between variables. These arrows represent both the self-predictive effects of each variable and the time-delayed reciprocal influences between two variables.
- Citation: Byeon H. Tracing the hidden links between sadness, aggression, and peer victimization in adolescents. World J Psychiatry 2025; 15(9): 110352
- URL: https://www.wjgnet.com/2220-3206/full/v15/i9/110352.htm
- DOI: https://dx.doi.org/10.5498/wjp.v15.i9.110352


