Copyright
©The Author(s) 2025.
World J Psychiatry. May 19, 2025; 15(5): 98436
Published online May 19, 2025. doi: 10.5498/wjp.v15.i5.98436
Published online May 19, 2025. doi: 10.5498/wjp.v15.i5.98436
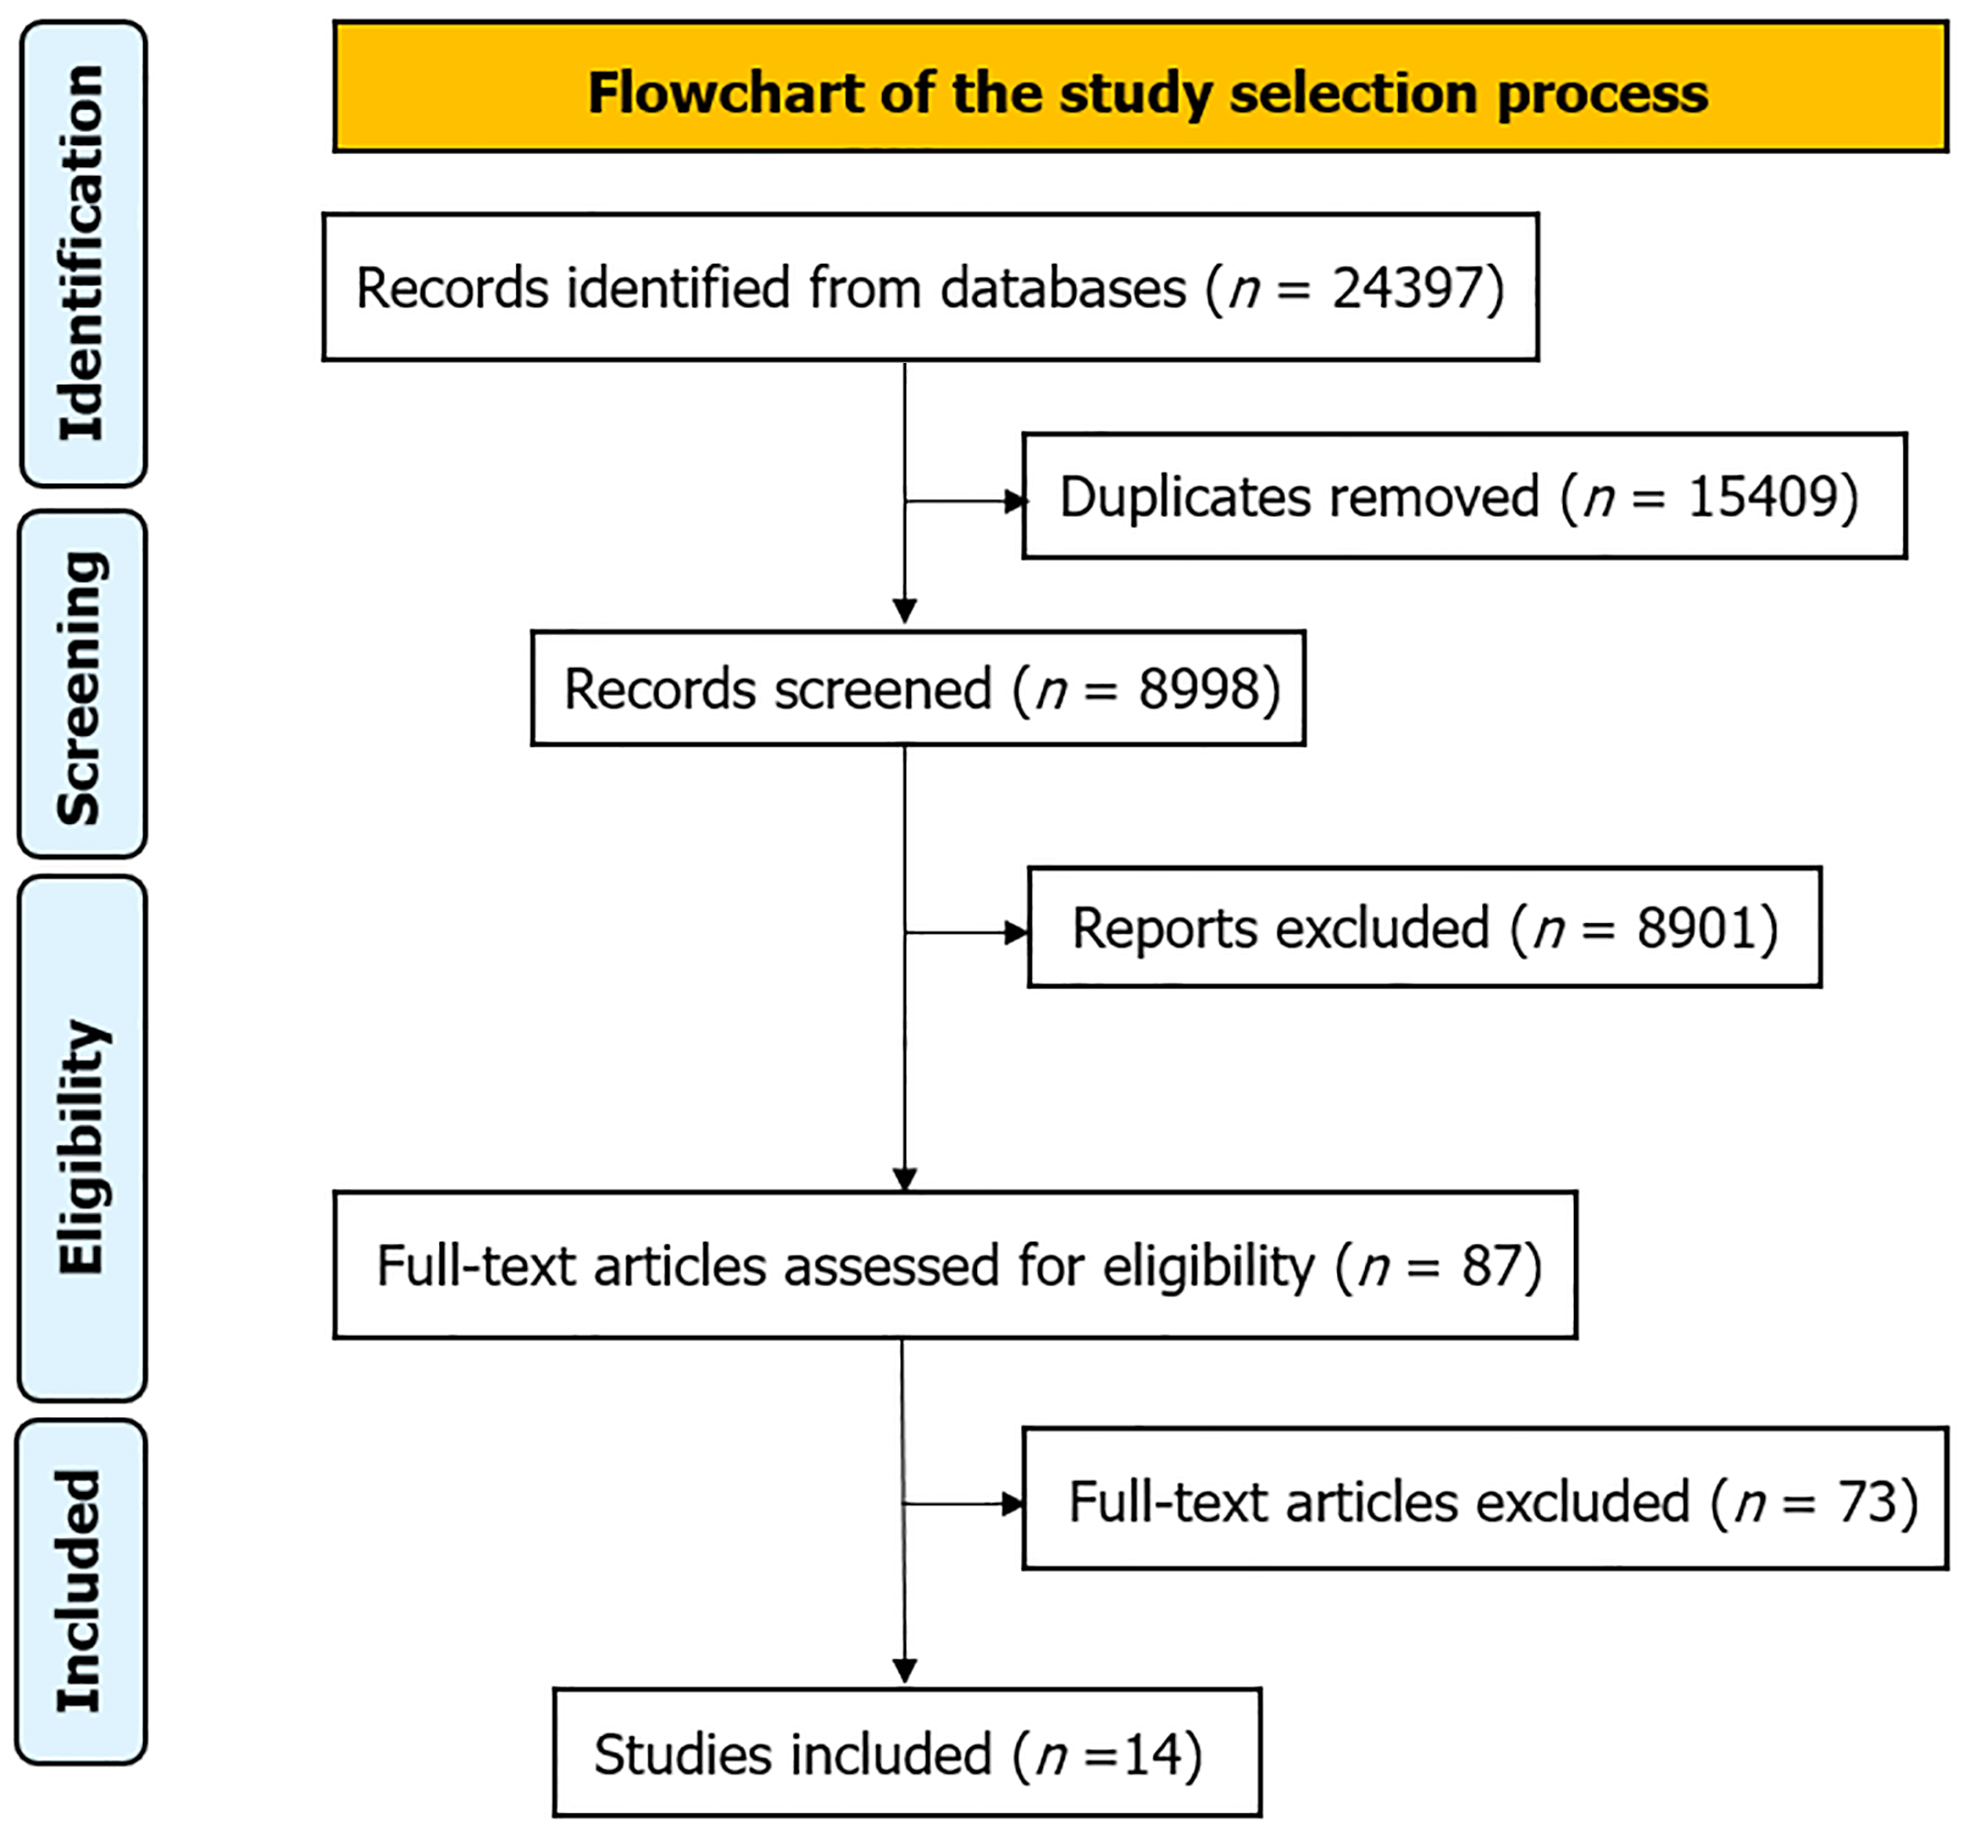
Figure 1 Flowchart of study selection process.
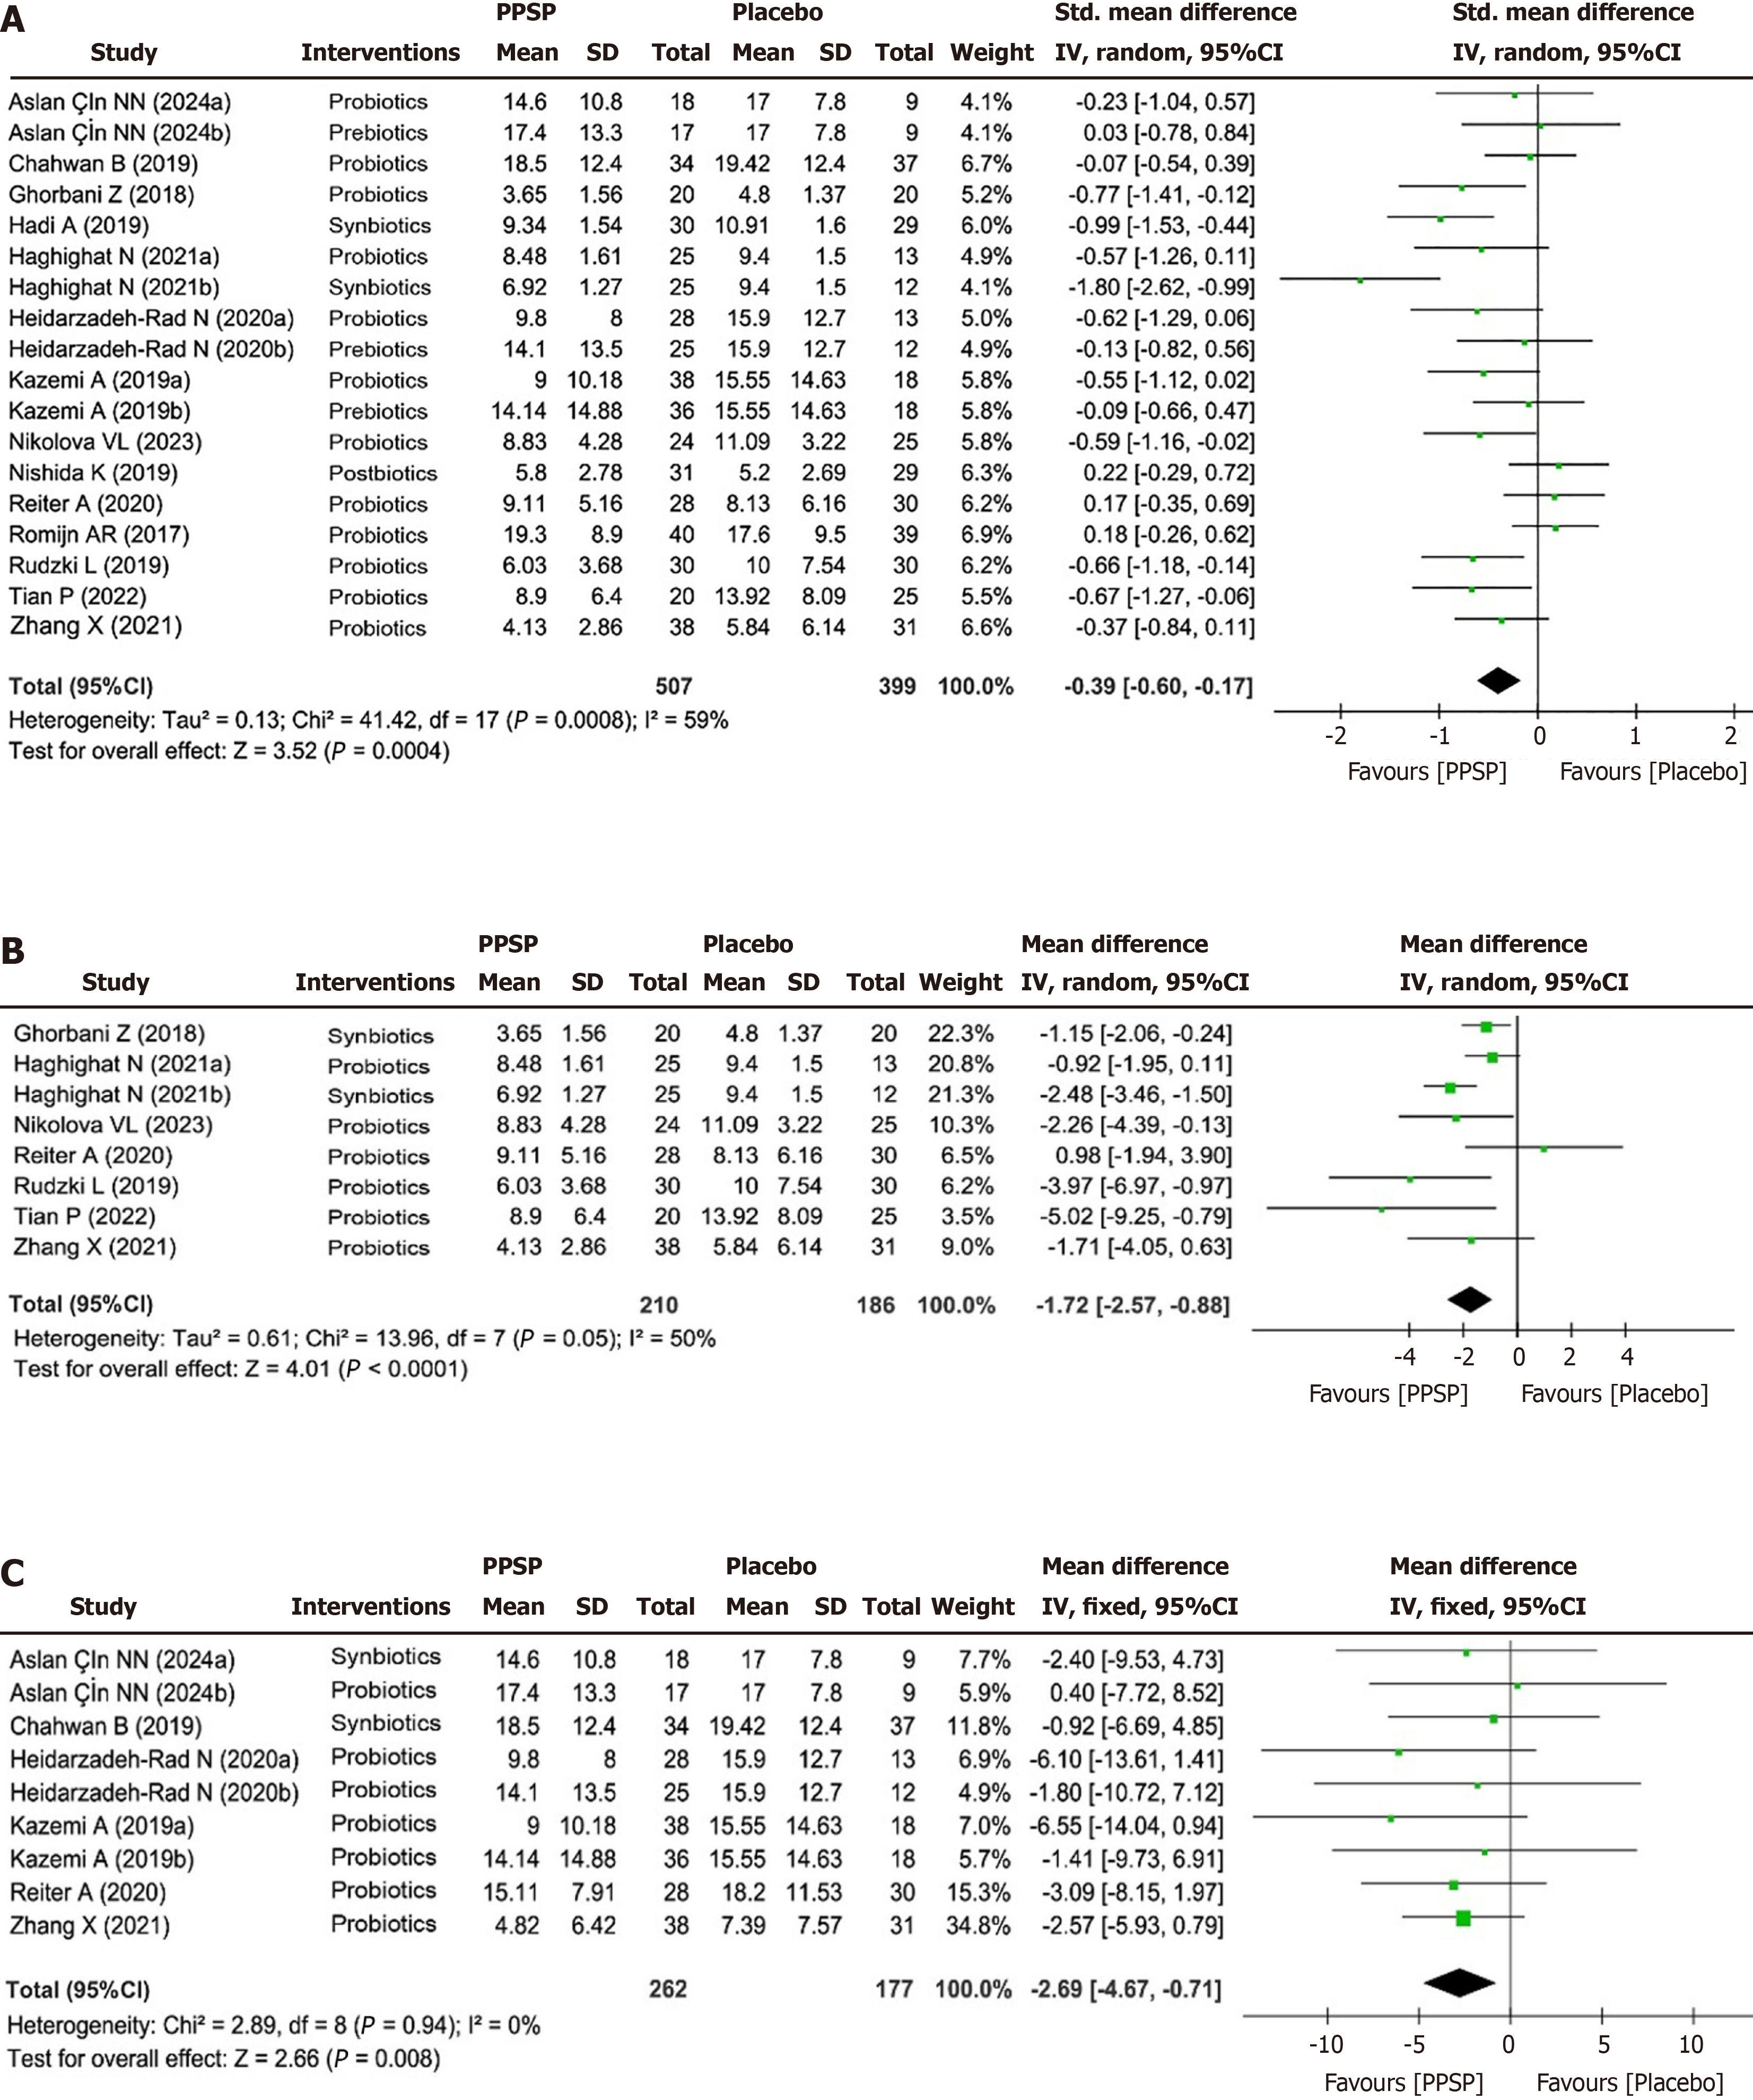
Figure 2 Forest plot of the pooled effect of probiotics, prebiotics, synbiotics, and postbiotics on depression symptoms.
A: Overall effect of probiotics, prebiotics, synbiotics, and postbiotics (PPSP); B: Effect of PPSP based on Hamilton Depression Rating Scale; C: Effect of PPSP based on Beck Depression Inventory. PPSP: Probiotics, prebiotics, synbiotics, and postbiotics.
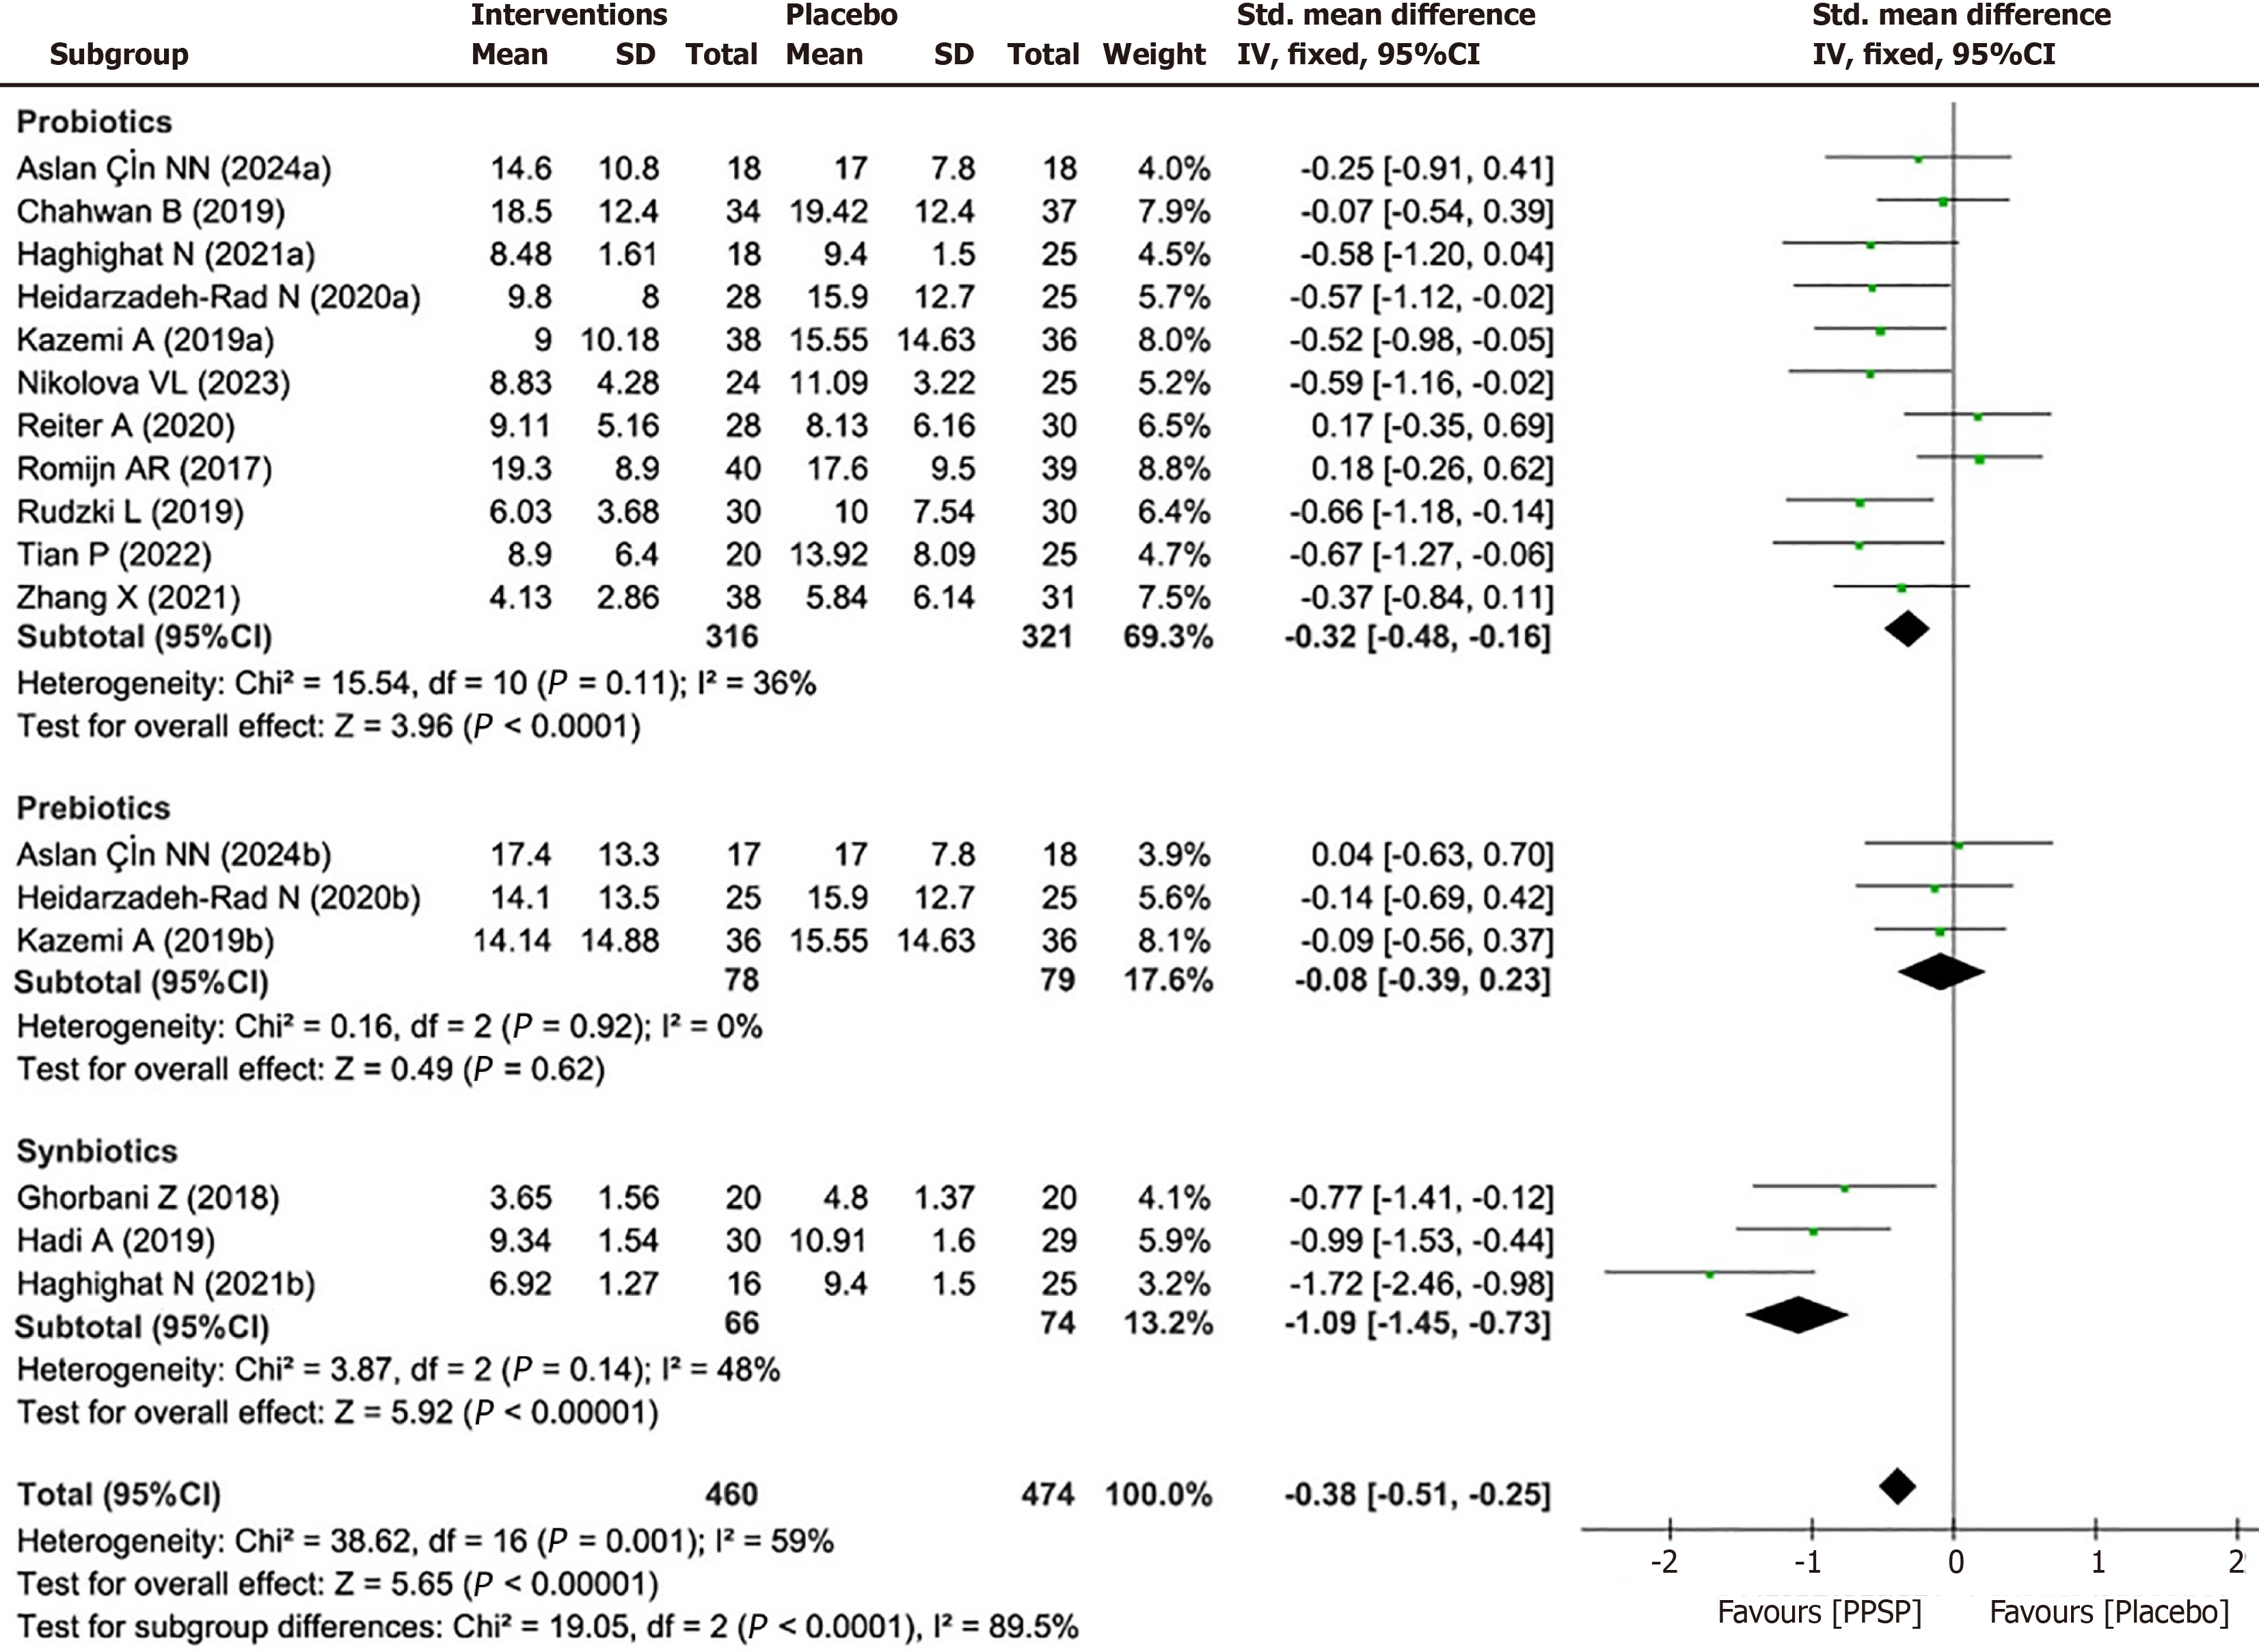
Figure 3 Forest plot of sub-analysis of different gut microbiota-targeting interventions.
Figure 4 Risk of bias for included studies.
Figure 5 Funnel plot for publication bias.
A: Overall effect of probiotics, prebiotics, synbiotics, and postbiotics (PPSP); B: Effect of PPSP based on Hamilton Depression Rating Scale; C: Effect of PPSP based on Beck Depression Inventory.
- Citation: Dai LY, Chen RR, Chen HR, Yin JH, Huang ZX, Yin BW, Liu XY. Potential clinical benefits of probiotics, prebiotics, synbiotics, and postbiotics for depression via the microbiota-gut-brain axis. World J Psychiatry 2025; 15(5): 98436
- URL: https://www.wjgnet.com/2220-3206/full/v15/i5/98436.htm
- DOI: https://dx.doi.org/10.5498/wjp.v15.i5.98436


