Copyright
©2014 Baishideng Publishing Group Inc.
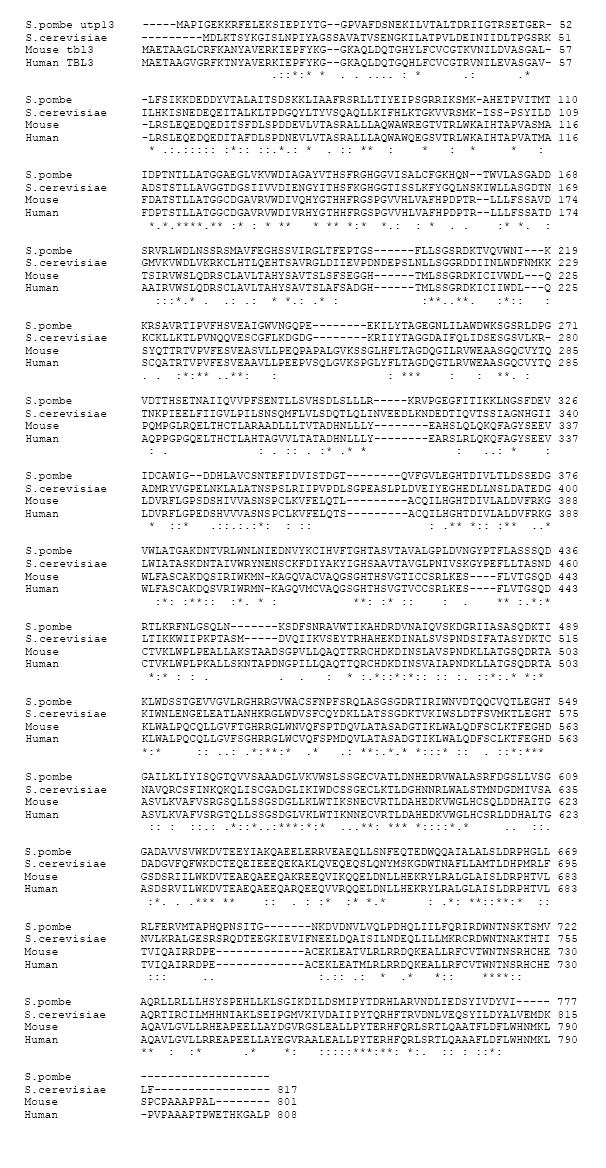
Figure 1 Sequence analyses of mouse transducin β-like 3, human transducin β-like 3 and yeast upt13.
Amino acid sequence alignment of mouse transducin β-like 3 (Tbl3), human TBL3, Schizosaccharomyces pombe (S. pombe) utp13 and Saccharomyces cerevisiae (S. cerevisiae) utp13 using the Clustal program. “*” indicates identical aa; “:” indicates conserved substitution; “.” indicates semiconserved substitution.
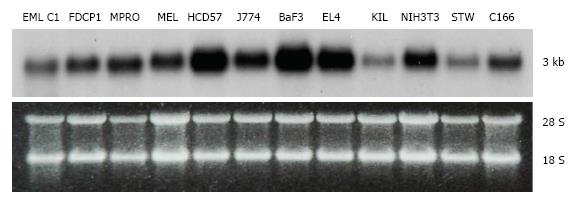
Figure 2 Tissue expression of transducin β-like 3.
Northern blot analysis of the transducin β-like 3 (Tbl3) message (approximately 3 kb) in select mouse cell lines. The bottom panel is the corresponding ethidium bromide-stained gel showing similar loading. Each lane contained 10 μg of total RNA. The 28S and 18S rRNAs are indicated. EML C1: A multipotent hematopoietic progenitor line[38]; FDCP1: A bipotent granulocyte-monocyte progenitor line; MPRO: A promyelocytic line[23]; MEL: A murine erythroleukemia line; HCD57: An erythroblast line[28]; J774: A macrophage line; BaF3: A pre-B lymphoma line; EL4: A T cell-like lymphoma line; KIL: A natural killer line[39]; NIH3T3: An embryonic fibroblast-like line; STW: A bone marrow stromal cell line; C166: A yolk sac-derived endothelial line.
Figure 3 Nucleolar localization of Tbl3-enhanced green fluorescent protein.
NIH 3T3 cells were transfected with the p-enhanced green fluorescent protein (EGFP) N1-transducin β-like 3 (Tbl3) construct. Cells were examined by fluorescence microscopy 20 h. after transfection. A: Differential interference contrast (DIC) microscopy of three fibroblasts revealing the nucleoli; B: Merged tbl3-EGFP green fluorescence and DIC of the cells shown in panel A. The nucleolar localization of tbl3-EGFP was verified by confocal microscopy; C: DAPI staining of DNA in the nuclei of the same field; D: Green fluorescence alone of the same field; E: DAPI plus tbl3-EGFP; F: Western detection of the tbl3-EGFP fusion protein. NIH 3T3 cells expressing tbl3-EGFP were lysed in RIPA buffer. The lysate (5 μg protein) was run on a 4%-12% NuPAGE gel (lane 2) along with Magic Mark size markers (lane 1), blotted and probed with an anti-GFP monoclonal antibody and visualized by enhanced chemiluminescence.
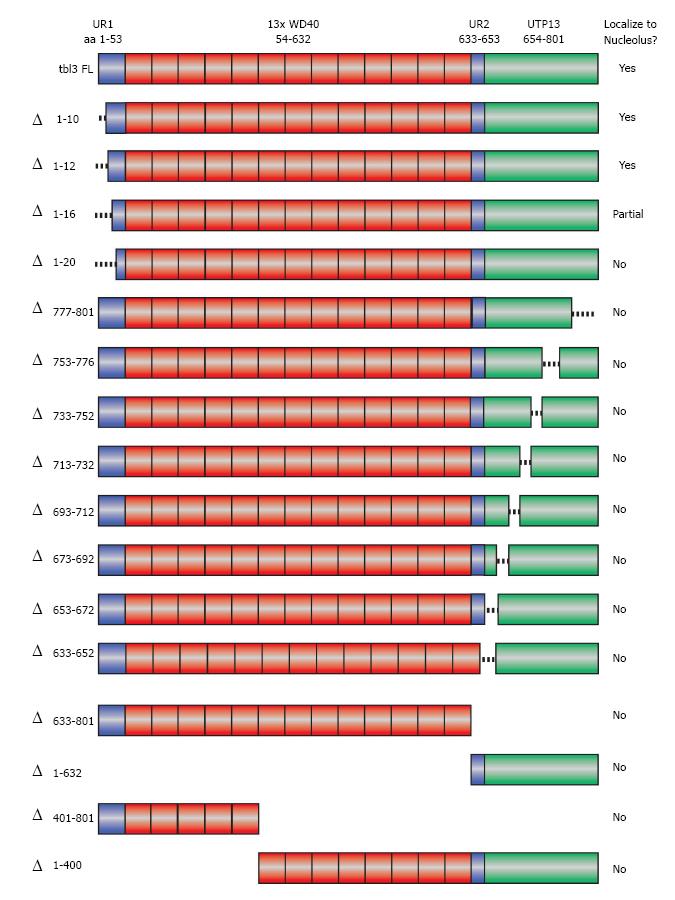
Figure 4 Scanning deletions of tbl3 and their effects on nucleolar targeting.
A schematic summary of the deletions of transducin β-like 3 (tbl3) tested in the localization study. Shown at the very top is the modular structure of tbl3. “Δ” indicates deleted aa. Deletion mutants were expressed as C-terminal enhanced green fluorescent protein (EGFP) fusion proteins in NIH3T3 and examined by fluorescence microscopy. The results of localization are summarized in the right column. UR1: Unique region 1 (aa 1-53); WD40: Region containing thirteen WD40 repeats (aa 54-632); UR2: Unique region 2 (aa 633-653); UTP13: Conserved C-terminal domain (aa 654-801).
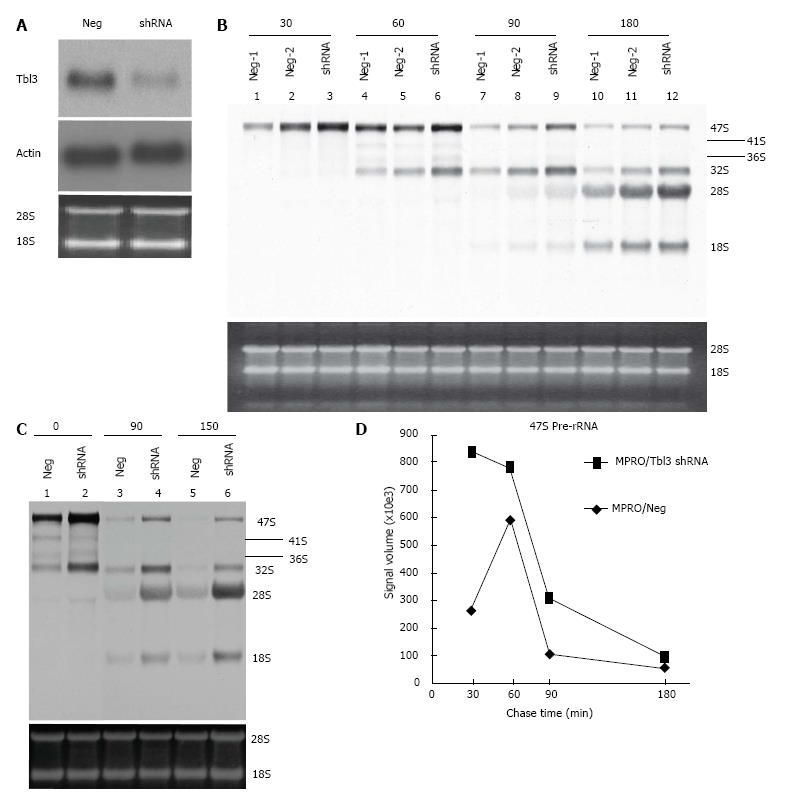
Figure 5 Effects of transducin β-like 3 knockdown on rRNA levels.
A: Specific knockdown of transducin β-like 3 (Tbl3) by small hairpin RNAs (shRNAs). MRPO cells were transfected with pMKO (negative control) vs pMKO-Tbl3 shRNA and selected with puromycin to establish stable transfectants. Ten μg of total RNAs of stable transfectants were subjected to Northern analysis using a 32P-labeled Tbl3 probe. The knockdown effect is 50%-70%. Middle panel: The same blot probed with a β-actin probe. Bottom panel: ethidium bromide-stained gel showing equal loading. The positions of the 28S and 18S rRNA are indicated; B: Tbl3 knockdown increases the level of newly synthesized 47S pre-rRNA but has no discernible effect on rRNA processing. MPRO stably transfected with pMKO (negative control) or pMKO-Tbl3 shRNA were pulse labeled with 3H-uridine for 30 min, washed and chased for 0, 30, 60, 90 and 180 min with fresh medium without 3H-uridine. Total RNAs were purified, electrophoresed and Northern blotted. 3H-uridine-labeled rRNAs were visualized by fluorography. Tbl3 knockdown consistently increases the level of the 47S pre-rRNA by about 2-4 fold. Two negative controls (Neg-1 and Neg-2) are included to show the range of variation in signal strength in the negative control group. Bottom panel: Ethidium bromide-stained gel showing similar steady-state levels of 28S and 18S rRNAs (and the 5.8S rRNA; not shown). Each lane contained total RNAs purified from equal numbers of starting cells. No adjustment was made on the basis of RNA concentration or yield; C: An independent Tbl3 knockdown experiments similar to that described in B but the analysis was performed after 0, 90 and 150 minutes of chase. The 41S and 36S are better visualized in this blot. Bottom panel: Ethidium bromide-stained gel showing similar steady-state levels of 28S and 18S rRNAs (and the 5.8S rRNA; not shown). Each lane contained total RNAs purified from equal numbers of starting cells. No adjustment was made on the basis of RNA concentration or yield; D: Time course of disappearance of 3H-uridine-labeled 47S pre-rRNAs. The fluorograph in B was analyzed and the measured signal volume was plotted against time. Note that 3H-uridine incorporation peaked earlier (30 min vs 60 min) in the shRNA group, consistent with the notion that tbl3 knockdown increased the rate of pre-rRNA synthesis. There is no evidence of delay of processing of the 47S pre-rRNA in the shRNA group during the most relevant (60-90 min) or later (90-180 min) period judging from the slopes of decline.
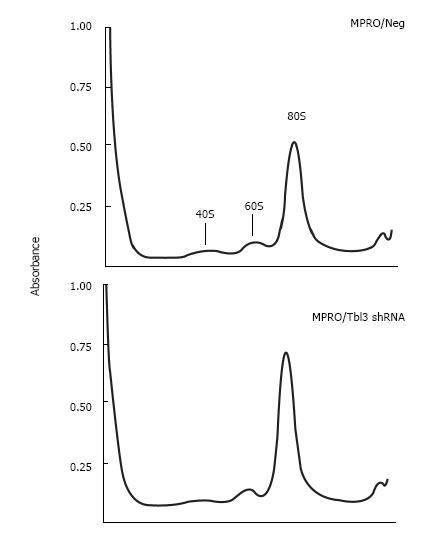
Figure 6 Knockdown of transducin β-like 3 has no discernable effect on ribosome profiles.
Cell lysates prepared from equal numbers of MPRO/pMKO vs pMKO-transducin β-like 3 (Tbl3) small hairpin RNAs (shRNAs) stable transfectants were analyzed by sucrose gradient centrifugation in the absence of cycloheximide, followed by absorbance measurement at 254 nmol/L. (The omission of cycloheximide allowed polysomes to dissociate into 80S monosomes to facilitate the comparison of the total amount of 80S monosomes.) The peaks corresponding to the 40S and 60S ribosomal subunits and the 80S monosomes are indicated. The slight difference in the 80S monosome peaks is due to unequal loading and well within experimental variations.
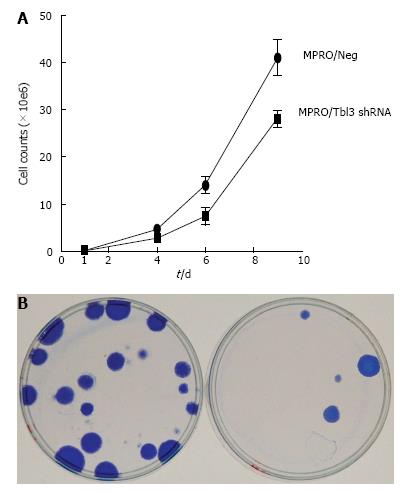
Figure 7 Knockdown of transducin β-like 3 inhibits cellular proliferation.
A: Growth curves of stable MPRO/pMKO (negative control) vs MPRO/pMKO-transducin β-like 3 (Tbl3) small hairpin RNAs (shRNAs) transfectants. Each culture was started with 105 low-passage stable transfectants. Each data symbol represents the mean of triplicates and the standard deviation; B: Tbl3 knockdown markedly inhibits the proliferation of fibroblasts, left: LAP3/Neg; right: LAP3/Tbl3 shRNA. LAP-3 fibroblasts were transfected with pMKO or pMKO-Tbl3 shRNA and selected with puromycin (1.5 μg/mL) for 5-10 d to allow colony formation of stable transfectants. Colonies were fixed and stained with Coomassie blue in situ and photographed. Plates shown are representative of three independent experiments.
-
Citation: Wang J, Tsai S.
Tbl3 encodes a WD40 nucleolar protein with regulatory roles in ribosome biogenesis. World J Hematol 2014; 3(3): 93-104 - URL: https://www.wjgnet.com/2218-6204/full/v3/i3/93.htm
- DOI: https://dx.doi.org/10.5315/wjh.v3.i3.93


