Copyright
©2014 Baishideng Publishing Group Inc.
World J Hematol. Aug 6, 2014; 3(3): 105-114
Published online Aug 6, 2014. doi: 10.5315/wjh.v3.i3.105
Published online Aug 6, 2014. doi: 10.5315/wjh.v3.i3.105
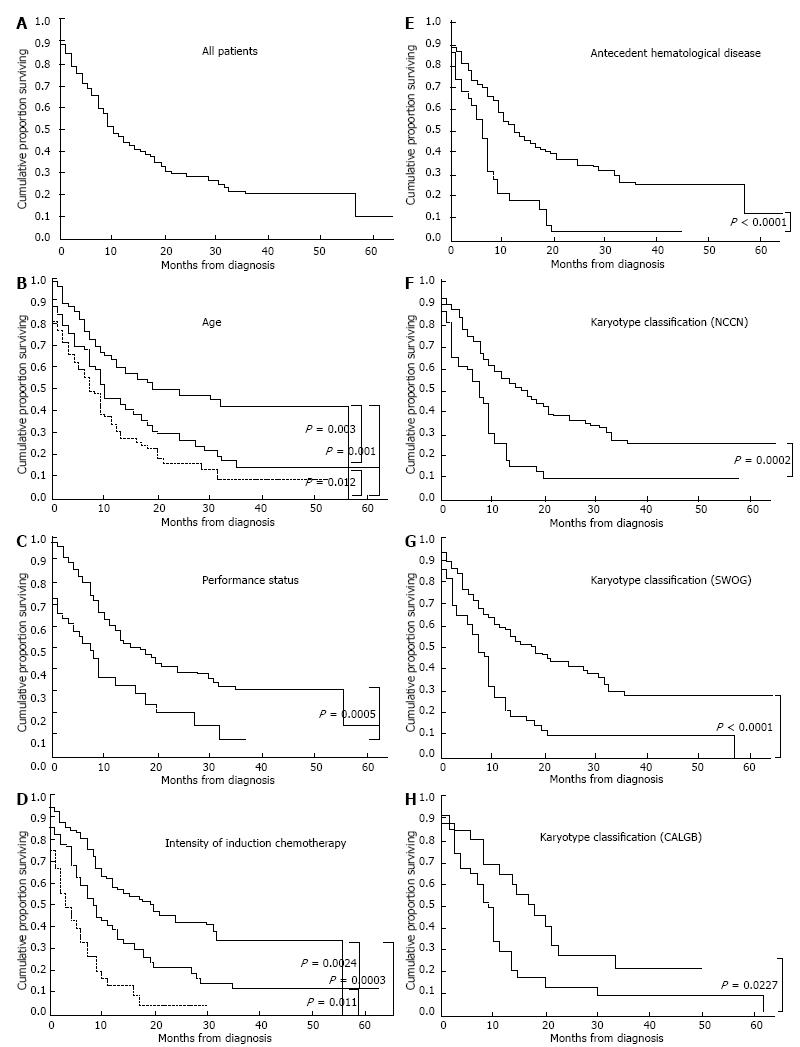
Figure 1 Kaplan-Meier estimate of overall survival in patients with non-acute promyelocytic leukemia.
A: All patients; B: Patients categorised by age group. Black line, ≤ 64 years; dotted line, 65-74 years; grey line, ≥75 years; C: Patients categorised by performance status (PS). Black line, PS 0-2; dotted line, PS 3-4; D: Patients categorised by intensity of induction chemotherapy. Black line, intensive chemotherapy; dotted line, less intensive chemotherapy; grey line, best supportive care; E: Patients categorised by antecedent hematological disease. Black line, without antecedent hematological disease; dotted line, with antecedent haematological disease; F: Patients categorised according to the National Comprehensive Cancer Network (NCCN) clinical practice guidelines karyotype classification. Black line, favourable and intermediate risk karyotypes; dotted line, unfavourable risk karyotypes; G: Patients categorised according to the Southwest Oncology Group (SWOG) karyotype classification. Black line, favourable and intermediate risk karyotypes; dotted line, unfavourable risk karyotypes; H: Patients categorised according to the Cancer and Leukemia Group B (CALGB) karyotype classification. Black line, favourable and intermediate risk karyotypes; dotted line, unfavourable risk karyotypes.
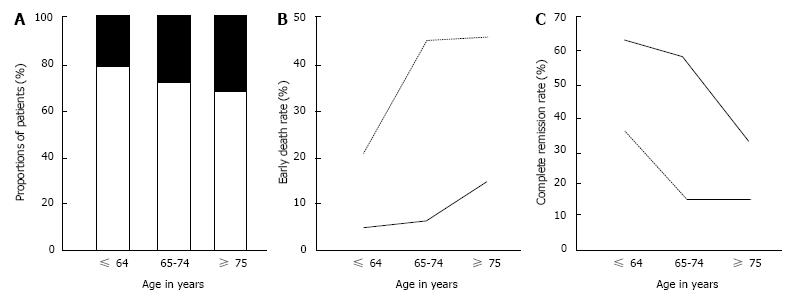
Figure 2 Early death rate and complete remission rate according to performance status in different age groups.
A: Proportions of patients with good and poor performance status (PS) in different age groups. Grey, PS 0-2; black, PS 3-4; B: Early death rate according to PS in different age groups. Black line, PS 0-2; dotted line, PS 3-4; C: Complete remission rate according to PS in different age groups. Black line, PS 0-2; dotted line, PS 3-4.
- Citation: Ohnishi H, Imataki O, Kawachi Y, Ide M, Kawakami K, Waki M, Takimoto H, Hoshijima Y, Fukumoto T, Matsumoto K, Waki F, Matsuoka A, Shintani T, Uemura M, Yokokura S, Taoka T, Matsunaga T. Age is an independent adverse prognostic factor for overall survival in acute myeloid leukemia in Japan. World J Hematol 2014; 3(3): 105-114
- URL: https://www.wjgnet.com/2218-6204/full/v3/i3/105.htm
- DOI: https://dx.doi.org/10.5315/wjh.v3.i3.105


