Copyright
©2014 Baishideng Publishing Group Inc.
World J Hematol. Aug 6, 2014; 3(3): 105-114
Published online Aug 6, 2014. doi: 10.5315/wjh.v3.i3.105
Published online Aug 6, 2014. doi: 10.5315/wjh.v3.i3.105
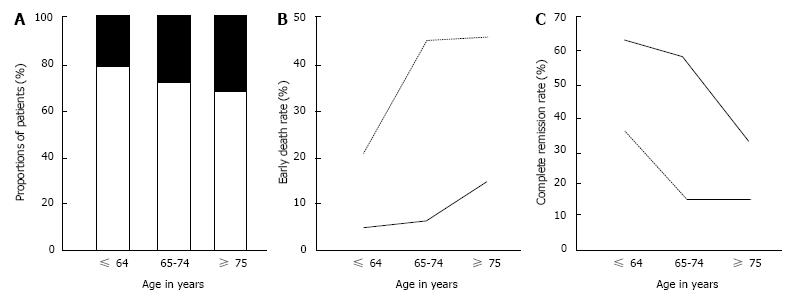
Figure 2 Early death rate and complete remission rate according to performance status in different age groups.
A: Proportions of patients with good and poor performance status (PS) in different age groups. Grey, PS 0-2; black, PS 3-4; B: Early death rate according to PS in different age groups. Black line, PS 0-2; dotted line, PS 3-4; C: Complete remission rate according to PS in different age groups. Black line, PS 0-2; dotted line, PS 3-4.
- Citation: Ohnishi H, Imataki O, Kawachi Y, Ide M, Kawakami K, Waki M, Takimoto H, Hoshijima Y, Fukumoto T, Matsumoto K, Waki F, Matsuoka A, Shintani T, Uemura M, Yokokura S, Taoka T, Matsunaga T. Age is an independent adverse prognostic factor for overall survival in acute myeloid leukemia in Japan. World J Hematol 2014; 3(3): 105-114
- URL: https://www.wjgnet.com/2218-6204/full/v3/i3/105.htm
- DOI: https://dx.doi.org/10.5315/wjh.v3.i3.105


