Copyright
©The Author(s) 2015.
World J Orthop. Mar 18, 2015; 6(2): 221-235
Published online Mar 18, 2015. doi: 10.5312/wjo.v6.i2.221
Published online Mar 18, 2015. doi: 10.5312/wjo.v6.i2.221
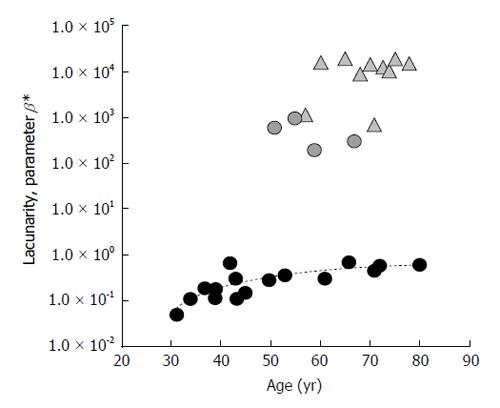
Figure 5 Results from trabecular bone architecture texture lacunarity analysis of magnetic resonance images with version 3 of the method.
Lacunarity of TBA from 30 subjects differing in age and physio-pathologic status is expressed by parameter β. Circles: age-related alteration of TBA in “healthy” subjects; Triangles: pathologic-related changes of TBA in osteoporotic BMD-based diagnosis subjects. Parameter β values directly correlate with fracture risk. TBA: Trabecular bone architecture; BMD: Bone mineral density.
- Citation: Zaia A. Fractal lacunarity of trabecular bone and magnetic resonance imaging: New perspectives for osteoporotic fracture risk assessment. World J Orthop 2015; 6(2): 221-235
- URL: https://www.wjgnet.com/2218-5836/full/v6/i2/221.htm
- DOI: https://dx.doi.org/10.5312/wjo.v6.i2.221


