Published online Aug 18, 2022. doi: 10.5312/wjo.v13.i8.733
Peer-review started: September 23, 2021
First decision: December 2, 2021
Revised: December 12, 2022
Accepted: July 26, 2022
Article in press: July 26, 2022
Published online: August 18, 2022
Processing time: 326 Days and 14.8 Hours
Fractures of the proximal femur epiphysis are problematic for state health care because they are associated with severe medical and social problems and high morbidity and mortality rates.
To model the potential risk of hip fracture via femur geometric parameters.
Seventy educational cadaveric femurs from people aged 14 to 80 years, 10 X-ray images from the records of the Human Anatomy Department and 10 X-ray images from the Department of Traumatology, Orthopedics and Disaster Surgery of Sechenov University, were evaluated. The parameters of the fractured bone were measured using images captured with a Canon d60 camera. The projection values of the proximal epiphysis of the cadaveric femurs and geometric parameters of the bones shown in the X-ray images were measured with Autodesk software (AutoCAD 2018). Analysis of the video frames showing bone rotation reveal that the greater trochanter can be inscribed in a parallelepiped, where one of the faces is parallel to the plane of view in the frontal standard projection and is rectangular. The angle of bone rotation obtained by turning the cube corresponded to the angle measured with the second technique. This reliable method of calculating the rotation of the bone relative to the anterior projection was employed in subsequent calculations. The geometric parameters of the femur were measured using X-ray images according to the proposed method.
The geometric parameters of 70 femurs were analyzed, and correlation coefficients were calculated. Our measurement results were compared with those reported by other authors. The potential influence of femur geometry on force distribution in the proximal epiphysis of the femur was described, and a 2-dimensional model of the femur epiphysis associated with minimal neck fracture risk was provided. The assessment of the geometric parameters of the femoral epiphysis indicated the greatest risk of a varus fracture of the neck if the angle of the minimal resistance zone (AMRZ) index > 24° and the neck-shaft angle (NSA) < 127.5°. In contrast, the minimum risk was observed at AMRZ < 14° and NSA > 128.87°.
The proposed method provides the potential femur neck fracture risk based on geometric parameters.
Core Tip: The neck-shaft angle (NSA) and angle of the minimal resistance zone [the area located in Ward's triangle (AMRZ)] were most associated with femoral neck fracture risk, and a method for calculating the true value of these parameters and risk stratification was developed. Assessment of the geometric parameters of the femoral epiphysis revealed the greatest risk of a varus fracture of the neck if the AMRZ index > 24° and NSA < 127.5°. In contrast, the minimum risk was observed at AMRZ < 14° and NSA > 128.87°.
- Citation: Shitova AD, Kovaleva ON, Olsufieva AV, Gadzhimuradova IA, Zubkov DD, Kniazev MO, Zharikova TS, Zharikov YO. Risk modeling of femoral neck fracture based on geometric parameters of the proximal epiphysis. World J Orthop 2022; 13(8): 733-743
- URL: https://www.wjgnet.com/2218-5836/full/v13/i8/733.htm
- DOI: https://dx.doi.org/10.5312/wjo.v13.i8.733
Fractures of the proximal epiphysis of the femur are problematic for state health care because they are associated with severe medical and social problems[1], high morbidity rates[2], disability[3,4], and high mortality rates[5]. Bone strength depends on the mineral density, architectonics and remodeling ability of bones[6], which change over time due to various factors. Characteristics such as bone mineral density, bone geometry and the properties of bone materials are factors that constitute bone quality[6]. The process by which bone strength decreases due to chemical composition changes and by which it decreases in trabecular density is referred to as osteoporosis[7].
The results of multiple studies on the causes and risk factors of bone deterioration, such as osteoporosis, have been introduced in clinical practice. The Fracture Risk Assessment Tool (FRAX)[8] scale was developed by individuals at the University of Sheffield to evaluate fracture risk; the scale assesses the influence of factors that cause a decrease in bone strength. The FRAX scale allows us to predict the ten-year probability of fracture, to identify patients who require more detailed examinations, including X-ray densitometry, and to prevent excessive radiation exposure[9].
In recent years, numerous studies have investigated the distribution of strain in bone under an applied load, identified areas that are highly influenced by stress and fracture risk and determined the influence of bone cytoarchitectonics and geometry on stress apportionment. High-resolution computed tomography and magnetic resonance tomography are employed in this field to analyze bone morphometric parameters[10]. Finite element analysis is a technique that is widely employed for bone model construction[11]. MATLAB is frequently utilized to calculate stress distributions in bone models[1]. The authors assessed changes in bone sample flexibility via a microhardness tester[12]. Other authors have detected structures in loaded femurs via a tension detector fixed to the bone[13]. The results of these investigations have been implemented in osteosynthesis operations[14] and endoprosthesis engineering applications[15].
This study aimed to determine the geometric parameters of the proximal femur that contribute most to femoral neck fracture. A method for measuring bone geometric parameters via X-ray images is provided since X-ray images are widely employed by general practitioners, and thus, may be preferable for use in screening studies. According to this finding, in this study, we will mostly rely on X-ray imaging, as a widely utilized diagnostic method.
Seventy femurs from the records of the Department of Human Anatomy at Sechenov University from people aged 14 to 80 years were selected to measure geometric parameters of the proximal epiphysis.
A video of femur rotation around the anatomic axis (for the estimation of the bone projection changes during the turning process) and stills from the video and X-ray images of the femur of 10 adult patients (18-24 years) were provided by the Department of Human Anatomy at Sechenov University (18-24 years), and 10 images of adult patients (18-63 years) were provided by the Department of Traumatology, Orthopedics and Disaster Surgery of Sechenov University (18-63 years). These X-ray images contained images of both femurs: one femur was fractured, and the other femur was intact and considered equal. The parameters of the fractured bone were measured using images captured with a Canon d60 camera.
The projection values of the proximal epiphysis of the femurs from the Department of Human Anatomy and geometric parameters of the bones shown in the X-ray images were measured with Autodesk software (AutoCAD 2018).
To ensure accurate measurements, centimeter rulers were attached to the bones, which helped to correctly scale the images. The projection that defines the femoral neck base and accuracy of the neck-shaft angle (NSA) measurements, i.e., the frontal standard projection (FSP), was selected to plot the segments signifying the main geometric parameters of the proximal epiphysis of the femur.
In this study, a method for assessing the morphometric parameters of the proximal femur based on the projection values and angle of rotation around the anatomical axis relative to the FSP was developed. In this study, the rotation angle was determined by the rotation of the cube installed on the tripod turning the bone. The rotation of the cube thus indicated the rotation of the bone at every point in time. The anatomical axis was drawn through the midpoint of the diaphyseal diameter. The mechanical axis passed through the center of the femoral head and the midpoint of the distal epiphysis of the thigh bone (half of the distance between the condyles). The femoral neck axis was determined by the segment passing through the center of the femoral head and the plane perpendicular to the midpoint of the upper base of the femoral neck.
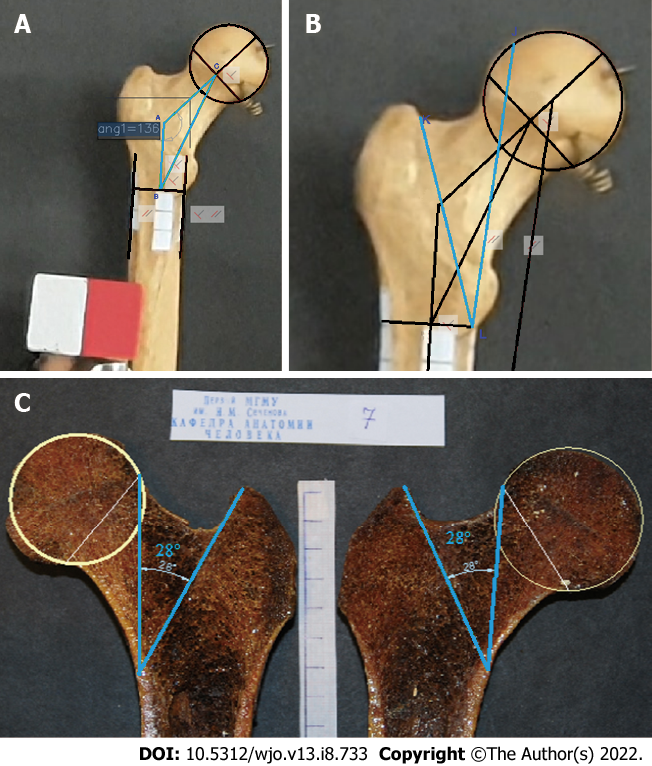
The triangle ABC designations, which are employed in formulas, comprising NSA (angle CAB); AC, the neck axis; and AB, the diaphyseal axis segment (connecting the diameter of the diaphysis to the neck axis), were plotted (Figure 1A) as a major component of the epiphysis of the proximal femur.
The angle between the principal compressive trabecular pattern and the secondary compressive group [angle of the minimal resistance zone (AMRZ)] was applied to assess the value of Ward’s triangle. The principal compressive trabecular pattern and secondary compressive group are indicated by segments KL and LJ, respectively. Segment KL was defined as the segment from the upper projection point of the distal base of the neck (point K) to the lower projection point of the lesser trochanter (point L). The segment LJ was defined as the segment parallel to the mechanical axis, which connects the center of the femoral head to the point between the femoral condyles and passes through point L (Figure 1B).
The minimal resistance zone was demonstrated using photos of gross sections of the proximal epiphysis of the femur from the Department of Human Anatomy at Sechenov University. Trabecular patterns, following the course of the main forces acting on the femoral epiphysis under physiological vertical loading, were clearly visualized on the gross sections. The direction of the chosen segments corresponded to the physiological stress lines and comprised a zone containing fewer trabeculae than were present in adjacent areas (Figure 1C).
The projection values of the proximal femoral geometry parameters are equal to their actual values if the bone is positioned such that the planes of the CAB and KLJ triangles are parallel to the plane of the screen onto which the bone is projected. If the bone is somehow rotated, its parameter cannot be measured directly. Therefore, the bone elements that can assist in determining the presence of bone rotation relative to the standard projection and in measuring its angle were selected.
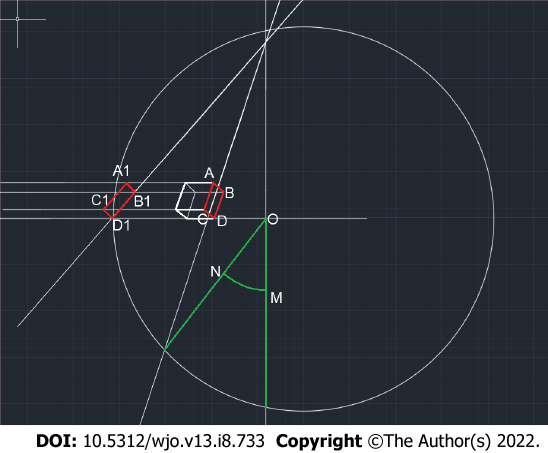
When analyzing the video frames that show bone rotation, we determined that the greater trochanter can be inscribed in a parallelepiped, one of the faces of which is a rectangle when the bone is in FSP. Consequently, this geometric parameter was chosen to evaluate the rotation of triangle ABC relative to the anatomical axis, to which segment AB is parallel. Thus, on an X-ray, the angle of rotation of the bone relative to the FSP can be determined by calculating the angle of rotation of the parallelepiped that contains the greater trochanter using spatial construction (Figure 2).
To assess the reliability of determining the angle of rotation on the basis of the greater trochanter, this angle was calculated by measuring the angle of rotation of the cube fixed to a tripod using the following formula:
QСN =135°- arcos (a1/a), where a is the edge of the cube (whose length is 50 mm) and a1 is the length of the cube verge in a projection other than the FSP.
The angle of bone rotation obtained by turning the cube corresponded to the angle measured with the second technique, which uses the previously described feature of the large spit. Thus, this method of calculating the rotation of the bone relative to the anterior projection was deemed reliable and utilized in subsequent calculations. During the rotation of the bone around axis AB to a random angle, triangle ABC was projected onto ABC1.
The change in the projection value of the NSA as a function of the angle of the rotation is represented by the following equation:
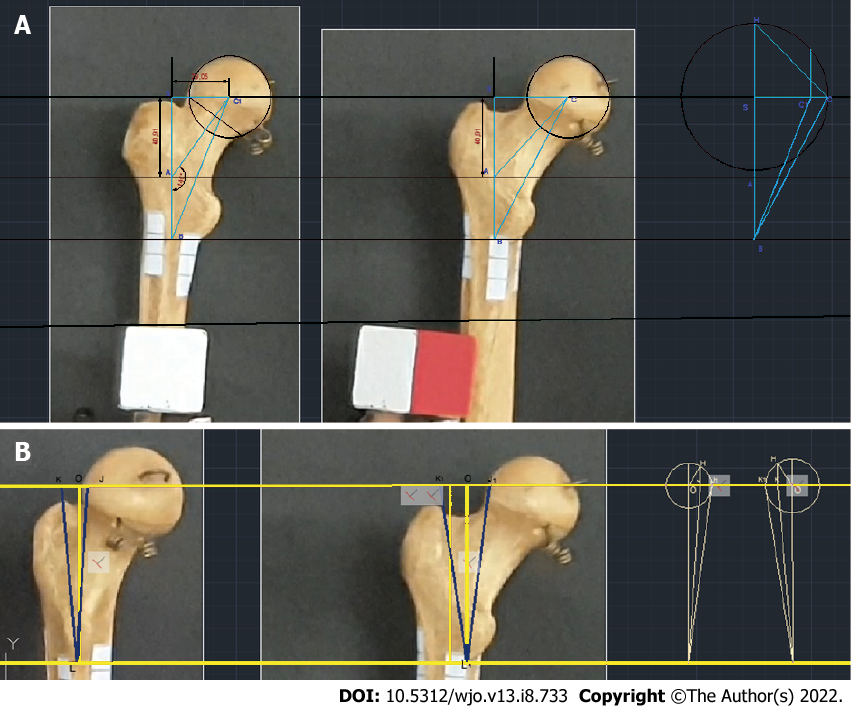
САВ = 180°-arctg (SA/(SC1/cosHSC)), where HSC is the angle of rotation, SA is the segment of the diaphyseal axis, and SC1 is the perpendicular segment, which passes through the center of the head of the femur to the diaphyseal axis (Figure 3A).
Based on the abovementioned findings, the formula for calculating the true value of the AMRZ takes into account the rotation of the bone:
K1L1J1 = acrtg (KO/(cos (KOH) × OL)) + arctg (OJ/(cos (JOH) × OL)), where KLJ is the projection AMRZ, K 1L 1J 1 is the true AMRZ, KO and ОJ are segments of the perpendicular line toward the diaphyseal axis passing through point J (Figure 3A), and KOH and JO indicate the angle of rotation.
A technique is proposed for determining the angle of rotation of the bone relative to the plane of the X-ray image based on the estimated rotation of the greater trochanter. In this technique, a box is created around the greater trochanter. Geometric constructions (Figure 2) are performed to estimate the angle of rotation similar to the technique previously mentioned for native bones and their videos.
Subsequently, this value is used to determine the true AMRZ. The change in the projection magnitude of the NSA as a function of the angle of rotation can be represented by the following equation:
САВ = 180о-arctg (SA/(SC1/cosHSC)), where HSC is the angle of rotation, SA is the segment of the axis of the diaphysis, and SC1 is the segment of the perpendicular line connecting the center of the femoral head to the axis of the diaphysis (Figure 3B).
The true value of the AMRZ was calculated as follows:
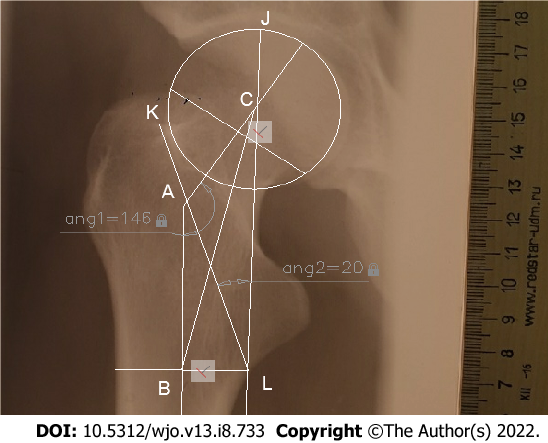
K1L1J1 = acrctg (KO/(cos (KOH) × OL)) + arctg (OJ/(cos (JOH) × OL)), where KLJ is the AMRZ projection, K1L1J1 is the true AMRZ, KO and ОJ are segments of the perpendicular line toward the axis of the diaphysis drawn through point J (Figure 2), and KOH and JOH are the angles of rotation (Figure 3B). When the plane including the axes of the neck and diaphysis is parallel to the plane of the X-ray, it is possible to directly measure the AMRZ (Figure 4).
This study does not take into account any parameters other than geometric parameters. Sex, age, concomitant diseases and other conditions can affect these parameters, but this study evaluates the results of these effects.
The results of a statistical analysis of the geometric parameters of the proximal epiphysis of the femur are presented in Table 1.
| Range | Mean value | Standard deviation | Standard error | Coefficient of variation | |
| Neck-shaft angle (degrees) | 103-144 | 125.99 | 9.09 | 1.08 | 0.07 |
| Angle of the minimal resistance zone (degrees) | 14-36 | 23.90 | 5.67 | 0.67 | 0.24 |
| АС | 32.3-61.48 | 48.60 | 7.10 | 0.84 | 0.15 |
| АВ | 17.94-57.3 | 38.61 | 10.05 | 1.19 | 0.26 |
| ВС | 55.51-94.42 | 78.00 | 8.66 | 1.03 | 0.11 |
| Upper neck length | 14.19-33.79 | 21.44 | 5.09 | 0.60 | 0.24 |
| Lower neck length | 21.72-45.94 | 33.67 | 5.19 | 0.62 | 0.15 |
The correlation coefficient for the correlation between the NSA and the AMRZ, for the correlation between segment BC and the zone of minimum resistance, and for the correlation between the length of segment BC and the upper-to-lower neck length ratio was -0.155, 0.0617, and -0.119, respectively, which indicates weak negative correlations among these parameters. These findings suggest that the NSA and AMRZ vary independently of each other, and regarding the influence of these changes on the risk of fracture of the femoral neck, they must be evaluated as independent values. The correlation coefficient between the NSA and the upper-to-lower neck length ratio was -0.396, that is, there was a moderate negative correlation between these parameters.
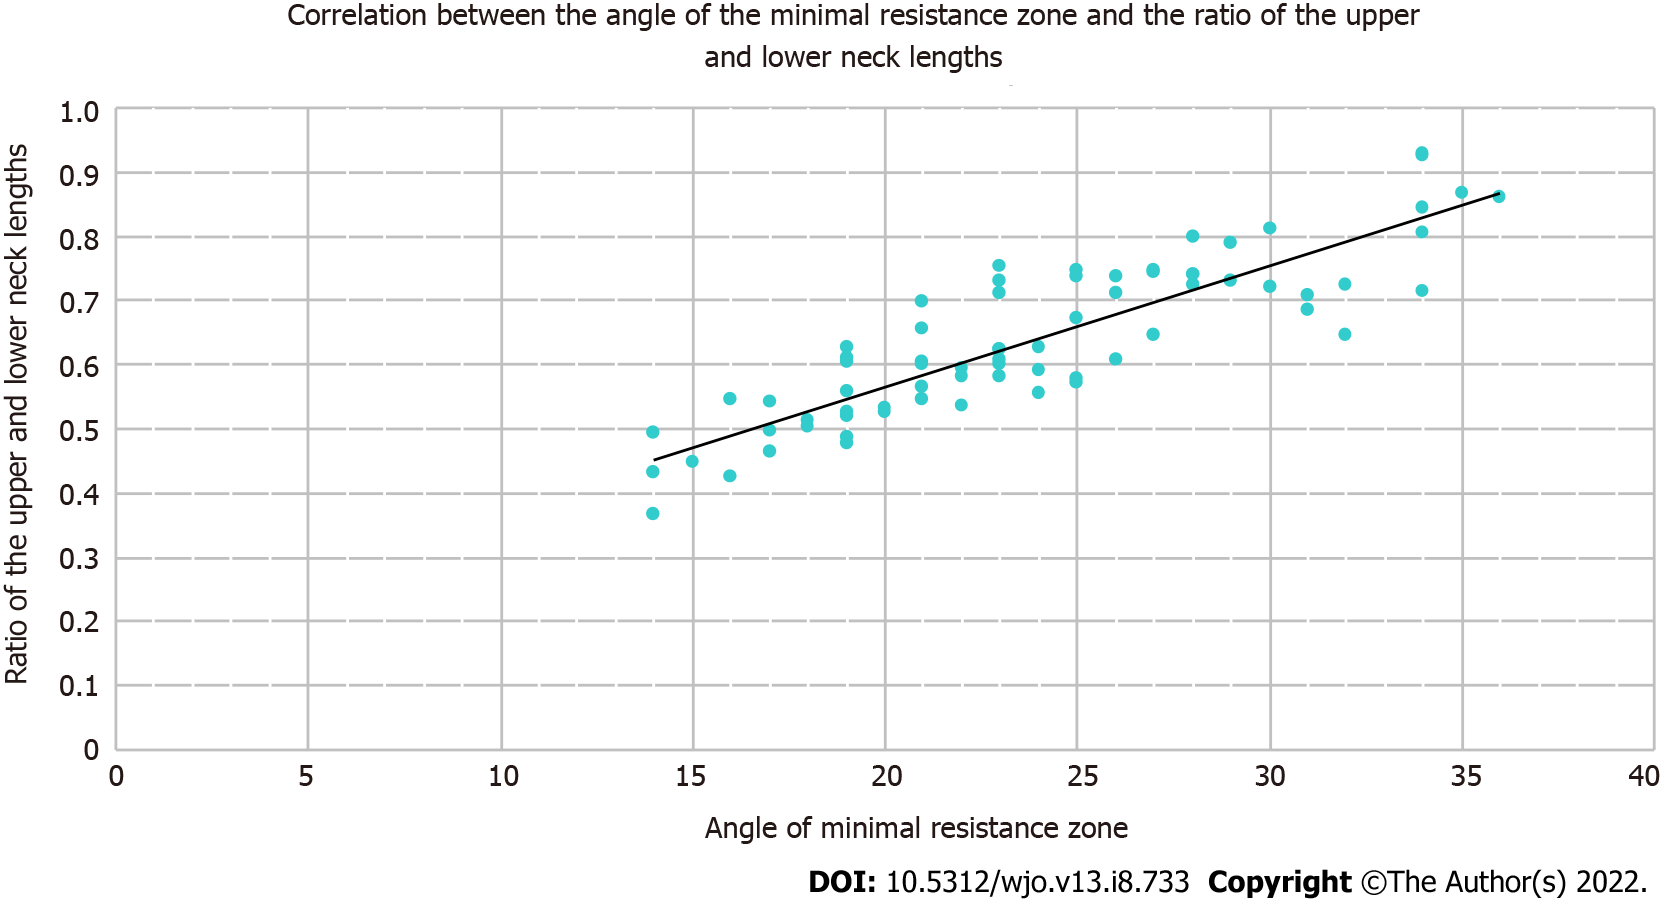
The strongest correlation was found between the AMRZ and the upper-to-lower neck length ratio, with a correlation coefficient of 0.872 (Figure 5). Based on this finding, we use the upper-to-lower neck length ratio to determine the size of the AMRZ.
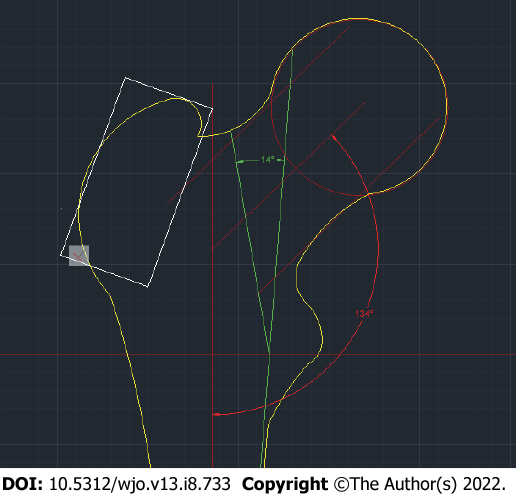
The model of the proximal epiphysis, which provides a minimal risk of femoral neck base fracture, consists of an NSA of 134° (which is 1° smaller than the mean of the maximal and mean values of this parameter shown in our study (144°+125.9°)/2 = 134.99о)) and an AMRZ of 14° (minimal value of the parameter in our study) (Figure 6).
The femoral proximal epiphysis, which has parameters included in this model, is the most resistant to femoral neck base fracture when a patient falls on his or her side, according to our study.
The scale was developed to evaluate the risk of femoral neck base fracture (Table 2). Scores were assigned to bone parameters within certain intervals, as specified in the table. According to the sum of the points, the degree of fracture risk for a given bone was determined: 2 points indicated low risk, 3-4 points indicated average risk, and 5-6 points indicated high risk. The analysis of 10 X-ray images stored in the Department of Human Anatomy and 10 X-ray images of patients from the Department of Traumatology, Orthopedics and Disaster Surgery of Sechenov University showed that the value of the NSA and AMRZ differed from the optimal value for all bones.
| Neck-shaft angle | Angle of minimal resistance zone | The ratio of the top and bottom neck lengths | |
| 1 point | 130.24 and more | 14 and less | 0.56 and less |
| 2 points | 127.5-130.24 | 18.95-29.95 | 0.57-0.74 |
| 3 points | Less than 127.5 | More than 29.95 | 0.75 and more |
We aimed to determine the bone parameters that are risk factors for a fracture of the base of the femoral neck when the patient falls on his or her side and did not take into account other types and mechanisms of fracture. However, the selected optimal values still remain within the reference values, even if they increase the risk of other mechanisms of femoral fracture.
In our study, we agree with the finding of several authors[16-20] that some bone parameters, such as NSA, have optimal values, and their deviations can cause a higher risk of fracture. In another study, the NSA value had a weak correlation with the size of the minimum resistance zone of the proximal femur (AMRZ), indicating that these parameters can independently influence fracture risk.
According to previous studies, neither a decrease in the NSA nor an increase in the NSA can be considered a reliable risk factor for femoral neck fracture since there are data that both confirm and disprove the influence of these factors on the probability of fracture[21-23]. Nevertheless, it has been confirmed that the strength of the proximal epiphysis decreases when the NSA decreases, and the stress that occurs in the proximal epiphysis under stress conditions shifts to its distal part. The femoral neck can be considered a lever, to the ends of which forces are applied. In this case, the value of the moment of forces that characterize the rotational action of forces acting on the proximal and distal part of the neck relative to the middle of the lever will increase as the NSA decreases. Based on measurements and a fracture risk assessment in another study, we assume that reducing the NSA causes an increase in the risk of femoral neck base fracture.
In the field of orthopedics, proximal femur modeling is utilized to plan interventions and assess their results[24]. When planning corrective osteotomy, to calculate the true value of the NSA using X-ray images, the researchers employed X-ray images of the hip joints projected directly in the middle position, with internal rotation of the thigh, and in a position proposed by Lauenstein, with the mathematical tables proposed by Strzyzewski or Shartlain[19]. However, these measurements allow only approximate planning of the surgical intervention, so the results of the treatment depend heavily on the personal skills of the surgeon. 3-D modeling is considered a more accurate method; therefore, algorithms for calculating surgical interventions on 3D models have been introduced and are highly distributed[24-27].
Furthermore, modeling of the proximal femoral epiphysis is conducted to create mathematical models to assess the risk of fractures under the influence of external factors. In recent years, special attention has been given to the variability of the shape of the proximal femur and the influence of its geometry on its strength[28]. For this purpose, statistical shape models are employed to simultaneously assess the impact of risk factors and pathological changes in a variety of bone geometric phenotypes[29]. The analysis of the geometric and strength characteristics of cadaveric proximal femurs continues to be applied for more accurate construction of mathematical models[30,31].
However, in most cases, statistical shape models require three-dimensional images using tomographic methods. Since the 3D model is associated with a high computational burden, Jazinizadeh et al[32] compared the ability of 2D and 3D femur models to predict hip fracture risk and showed that their productiveness does not differ significantly.
We propose a method for calculating the true parameters of the proximal epiphysis based on one projection obtained using an X-ray image. Our technique is assumed to prevent the occurrence of femoral fracture in primary health care practice, unlike other techniques designed to correct the consequences of a fracture. We assume that our method can be used in combination with existing methods for assessing the risk of fractures, since it does not contradict but can complement other methods.
Our study has a retrospective design, which is its first limitation. In the course of this work, a small number of X-ray images were selected; other types and mechanisms of fracture were not taken into account; and any parameters of bone tissue, other than geometric characteristics, were not taken into account. With regard to the selection of cadaveric bones, the age, gender and other parameters of the owners of the bones were not taken into account. In addition, the impact of other risk factors for hip fractures has not been evaluated, and densitometry studies have not been performed.
The scale needs to be evaluated further in future studies and is not ready for use in clinical practice. However, the measurement of these parameters during screening studies can reduce the risk of severe injuries.
The suggested method for measuring the true parameters of the proximal femur does not require special equipment but is quite difficult to implement. This method can be used when special software is not available and in combination with other screening tools that use X-ray scans of the femur. Further improvements to this method are needed. Nevertheless, performing such measurements with modern X-ray diagnostic systems is not difficult. This method is assumed to be combined with other screening techniques and to be employed when other less complicated measurement methods are not available.
Disease prophylaxis via the assessment of risk factors and prevention is essential in modern medicine. Therefore, methods for assessing and diminishing risk should be developed. The method described in this article is assumed to be a tool for first-level health care to predict severe disabling damage. Early detection of the anatomic predisposition to fracture as well as the identification of osteoporosis shall allow general practitioners to identify patients who are in the femur fracture risk group because of proximal femur geometry pathological changes and to take opportune actions for bone strengthening. This screening approach will decrease morbidity, mortality and the costs required for treatment and rehabilitation. Simultaneously, with a decline in incidence, mortality is also expected to decrease. The plotting methods proposed in this study could also be applied to design mathematical models for preoperative preparations. However, in this way, these methods should be further developed.
Currently, a fracture of the femoral neck is a serious health problem, as it very often leads to long-term hospitalization, disability and death of patients. Modern medicine implies the prevention of such serious injuries and their consequences. At the moment, there are methods for assessing bone mineral density, but its geometry remains beyond attention.
This study was created for the reasons that existing methods often do not take into account the geometric parameters of the bone, and is aimed at filling this gap and creating techniques that complement existing ones.
The purpose of this work was to study the influence of bone geometry on its strength, as well as to find ways to apply these data in practice. The results of the study were conceived as an addition to the existing methods of assessing the risk of fracture.
In our study, we measured 70 cadaveric bones and 20 X-rays by creating digital copies of them and processing them in the AutoCAD environment. The cuts of the proximal epiphyses of bones were studied. An analysis was also carried out aimed at identifying parameters correlating with a high risk of fracture. A scale was created as a possible risk assessment tool.
In our research, we studied the course of bone beams, the distribution of bone tissue in the proximal epiphysis and found the zone that is most vulnerable to mechanical stress. The parameters of the proximal epiphysis were investigated and those that may indicate a higher risk of fracture were identified. A scale was proposed and tested to assess this risk.
The geometric parameters of the bone reflect the features of the structure of the bone beams and the distribution of bone matter. There are parameters of the proximal epiphysis, the measurement of which with the help of modern imaging methods can help determine the increased risk of fracture of the proximal epiphysis of the femur. Modern methods of risk stratification often ignore the geometric parameters of the bone and our study suggests a way to take them into account to determine the risks of fracture.
In order to develop the idea, it is possible to conduct a larger-scale study with a large number of participants. Further refinement of the scale is needed in order to clarify it and possibly expand it. With satisfactory results of refinement, it is possible to introduce the proposed methodology into practice for its clinical trial.
The authors cordially thank Professor Nikolenko VN (Head of the Department of Human Anatomy, N.V. Sklifosovsky Institute of Clinical Medicine, I.M. Sechenov First Moscow State Medical University) for professional assistance.
Provenance and peer review: Unsolicited article; Externally peer reviewed.
Peer-review model: Single blind
Specialty type: Orthopedics
Country/Territory of origin: Russia
Peer-review report’s scientific quality classification
Grade A (Excellent): 0
Grade B (Very good): B
Grade C (Good): C
Grade D (Fair): 0
Grade E (Poor): 0
P-Reviewer: Mastrantonakis K, Greece; Primadhi RA, Indonesia S-Editor: Wu YXJ L-Editor: A P-Editor: Wu YXJ
| 1. | Raaymakers EL. Fractures of the femoral neck: a review and personal statement. Acta Chir Orthop Traumatol Cech. 2006;73:45-59. [PubMed] |
| 2. | Gnudi S, Ripamonti C, Gualtieri G, Malavolta N. Geometry of proximal femur in the prediction of hip fracture in osteoporotic women. Br J Radiol. 1999;72:729-733. [RCA] [PubMed] [DOI] [Full Text] [Cited by in Crossref: 106] [Cited by in RCA: 95] [Article Influence: 3.7] [Reference Citation Analysis (0)] |
| 3. | Slobogean GP, Sprague SA, Scott T, Bhandari M. Complications following young femoral neck fractures. Injury. 2015;46:484-491. [RCA] [PubMed] [DOI] [Full Text] [Cited by in Crossref: 175] [Cited by in RCA: 257] [Article Influence: 25.7] [Reference Citation Analysis (0)] |
| 4. | Bartels S, Gjertsen JE, Frihagen F, Rogmark C, Utvåg SE. Low bone density and high morbidity in patients between 55 and 70 years with displaced femoral neck fractures: a case-control study of 50 patients vs 150 normal controls. BMC Musculoskelet Disord. 2019;20:371. [RCA] [PubMed] [DOI] [Full Text] [Full Text (PDF)] [Cited by in Crossref: 9] [Cited by in RCA: 14] [Article Influence: 2.3] [Reference Citation Analysis (0)] |
| 5. | Major LJ, North JB. Predictors of mortality in patients with femoral neck fracture. J Orthop Surg (Hong Kong). 2016;24:150-152. [RCA] [PubMed] [DOI] [Full Text] [Cited by in Crossref: 16] [Cited by in RCA: 24] [Article Influence: 2.7] [Reference Citation Analysis (0)] |
| 6. | Armas LA, Lappe JM, Heaney RP. Calcium bone strength and fractures. In: Orwoll ES, Bilezikian JP, Vanderschueren D. Osteoporosis in men. USA: Academic Press, 2010: 235-241. [DOI] [Full Text] |
| 7. | International osteoporosis foundation. 9, rue Juste-Olivier CH-1260 Nyon - Switzerland; [cited 27 Mar 2021]. Available from: http://www.iofbonehealth.org/what-is-osteoporosis. |
| 8. | FRAX ®Fracture Risk Assessment Tool. Centre for Metabolic Bone Diseases, University of Sheffield, UK [cited 27 Mar 2021]. Available from: https://www.sheffield.ac.uk/FRAX/tool.aspx?country=9. |
| 9. | Tortora R, Imperatore N, Capone P, Gerbino N, Rea M, Affinito G, Caporaso N, Rispo A. FRAX Score Can Be Used to Avoid Superfluous DXA Scans in Detecting Osteoporosis in Celiac Disease: Accuracy of the FRAX Score in Celiac Patients. J Clin Densitom. 2018;21:315-321. [RCA] [PubMed] [DOI] [Full Text] [Cited by in Crossref: 8] [Cited by in RCA: 10] [Article Influence: 1.4] [Reference Citation Analysis (0)] |
| 10. | Donnelly E. Methods for assessing bone quality: a review. Clin Orthop Relat Res. 2011;469:2128-2138. [RCA] [PubMed] [DOI] [Full Text] [Full Text (PDF)] [Cited by in Crossref: 231] [Cited by in RCA: 196] [Article Influence: 14.0] [Reference Citation Analysis (0)] |
| 11. | Barkaoui A, Ben Kahla R, Merzouki T, Hambli R. Age and gender effects on bone mass density variation: finite elements simulation. Biomech Model Mechanobiol. 2017;16:521-535. [RCA] [PubMed] [DOI] [Full Text] [Cited by in Crossref: 15] [Cited by in RCA: 14] [Article Influence: 1.6] [Reference Citation Analysis (0)] |
| 12. | Makuch AM, Skalski KR, Pawlikowski M. The influence of the cumulated deformation energy in the measurement by the DSI method on the selected mechanical properties of bone tissues. Acta Bioeng Biomech. 2017;19:79-91. [PubMed] |
| 13. | Park G, Kim T, Forman J, Panzer MB, Crandall JR. Prediction of the structural response of the femoral shaft under dynamic loading using subject-specific finite element models. Comput Methods Biomech Biomed Engin. 2017;20:1151-1166. [RCA] [PubMed] [DOI] [Full Text] [Cited by in Crossref: 14] [Cited by in RCA: 10] [Article Influence: 1.3] [Reference Citation Analysis (0)] |
| 14. | Wieding J, Souffrant R, Fritsche A, Mittelmeier W, Bader R. Finite element analysis of osteosynthesis screw fixation in the bone stock: an appropriate method for automatic screw modelling. PLoS One. 2012;7:e33776. [RCA] [PubMed] [DOI] [Full Text] [Full Text (PDF)] [Cited by in Crossref: 59] [Cited by in RCA: 54] [Article Influence: 4.2] [Reference Citation Analysis (0)] |
| 15. | Ding HW, Yu GW, Tu Q, Liu B, Shen JJ, Wang H, Wang YJ. Computer-aided resection and endoprosthesis design for the management of malignant bone tumors around the knee: outcomes of 12 cases. BMC Musculoskelet Disord. 2013;14:331. [RCA] [PubMed] [DOI] [Full Text] [Full Text (PDF)] [Cited by in Crossref: 8] [Cited by in RCA: 11] [Article Influence: 0.9] [Reference Citation Analysis (0)] |
| 16. | Grapharov KZ. Clinical meaning of angle dimensions of femur in proximal region. Med Almanah. 2012;2:253-255. |
| 17. | Avdeev AI, Poteryaykin ES, Kottsova YM. The role of size and shape of proximal femur in determination of the biological age of adults. Bull Forensic Med. 2016;3:17-19. |
| 18. | Nikolenko VN, Fomicheva OA, Zhmurko RS, Yakovlev NM, Bessonova OS, Pavlov SV. Individual and typological morphometric features of the proximal femoral bone. Saratov J Med Sci Res. 2010;6:36-39. |
| 19. | Alekseev VP. Osteomeriya: metodika antropometricheskih issledovanij. Moscow: Nauka, 1966. |
| 20. | Bergot C, Bousson V, Meunier A, Laval-Jeantet M, Laredo JD. Hip fracture risk and proximal femur geometry from DXA scans. Osteoporos Int. 2002;13:542-550. [RCA] [PubMed] [DOI] [Full Text] [Cited by in Crossref: 86] [Cited by in RCA: 85] [Article Influence: 3.7] [Reference Citation Analysis (0)] |
| 21. | Villette CC, Zhang J, Phillips ATM. Influence of femoral external shape on internal architecture and fracture risk. Biomech Model Mechanobiol. 2020;19:1251-1261. [RCA] [PubMed] [DOI] [Full Text] [Full Text (PDF)] [Cited by in Crossref: 4] [Cited by in RCA: 3] [Article Influence: 0.5] [Reference Citation Analysis (0)] |
| 22. | Kim DK, Kim TH. Femoral neck shaft angle in relation to the location of femoral stress fracture in young military recruits: femoral head vs femoral neck stress fracture. Skeletal Radiol. 2021;50:1163-1168. [RCA] [PubMed] [DOI] [Full Text] [Full Text (PDF)] [Cited by in Crossref: 5] [Cited by in RCA: 7] [Article Influence: 1.8] [Reference Citation Analysis (0)] |
| 23. | Numis AL, Fox CH, Lowenstein DJ, Norris PJ, Di Germanio C. Comparison of multiplex cytokine assays in a pediatric cohort with epilepsy. Heliyon. 2021;7:e06445. [RCA] [PubMed] [DOI] [Full Text] [Full Text (PDF)] [Cited by in Crossref: 4] [Cited by in RCA: 9] [Article Influence: 2.3] [Reference Citation Analysis (0)] |
| 24. | Oba M, Kobayashi N, Inaba Y, Choe H, Ike H, Kubota S, Saito T. Mechanical Strength of the Proximal Femur After Arthroscopic Osteochondroplasty for Femoroacetabular Impingement: Finite Element Analysis and 3-Dimensional Image Analysis. Arthroscopy. 2018;34:2377-2386. [RCA] [PubMed] [DOI] [Full Text] [Cited by in Crossref: 8] [Cited by in RCA: 10] [Article Influence: 1.4] [Reference Citation Analysis (0)] |
| 25. | Yang P, Lin TY, Xu JL, Zeng HY, Chen D, Xiong BL, Pang FX, Chen ZQ, He W, Wei QS, Zhang QW. Finite element modeling of proximal femur with quantifiable weight-bearing area in standing position. J Orthop Surg Res. 2020;15:384. [RCA] [PubMed] [DOI] [Full Text] [Full Text (PDF)] [Cited by in Crossref: 5] [Cited by in RCA: 16] [Article Influence: 3.2] [Reference Citation Analysis (0)] |
| 26. | Dolatowski FC, Temmesfeld MJ, Pierre-Jerome C, Borthne A, Hoelsbrekken SE. Bilateral symmetrical comparison of the proximal femur using 3D-CT models. Surg Radiol Anat. 2018;40:507-513. [RCA] [PubMed] [DOI] [Full Text] [Cited by in Crossref: 3] [Cited by in RCA: 3] [Article Influence: 0.4] [Reference Citation Analysis (0)] |
| 27. | Shetty V, Wagh Y, Karade V, Maurya A, Parihar M, Shekhar S, Tandel J. CT-Based 3D Reconstruction of Lower Limb Versus X-Ray-Based 3D Reconstruction: A Comparative Analysis and Application for a Safe and Cost-Effective Modality in TKA. Indian J Orthop. 2021;55:1150-1157. [RCA] [PubMed] [DOI] [Full Text] [Cited by in Crossref: 4] [Cited by in RCA: 3] [Article Influence: 0.8] [Reference Citation Analysis (0)] |
| 28. | Hsu YH, Estrada K, Evangelou E, Ackert-Bicknell C, Akesson K, Beck T, Brown SJ, Capellini T, Carbone L, Cauley J, Cheung CL, Cummings SR, Czerwinski S, Demissie S, Econs M, Evans D, Farber C, Gautvik K, Harris T, Kammerer C, Kemp J, Koller DL, Kung A, Lawlor D, Lee M, Lorentzon M, McGuigan F, Medina-Gomez C, Mitchell B, Newman A, Nielson C, Ohlsson C, Peacock M, Reppe S, Richards JB, Robbins J, Sigurdsson G, Spector TD, Stefansson K, Streeten E, Styrkarsdottir U, Tobias J, Trajanoska K, Uitterlinden A, Vandenput L, Wilson SG, Yerges-Armstrong L, Young M, Zillikens MC, Rivadeneira F, Kiel DP, Karasik D. Meta-Analysis of Genomewide Association Studies Reveals Genetic Variants for Hip Bone Geometry. J Bone Miner Res. 2019;34:1284-1296. [RCA] [PubMed] [DOI] [Full Text] [Cited by in Crossref: 27] [Cited by in RCA: 30] [Article Influence: 5.0] [Reference Citation Analysis (0)] |
| 29. | Asvadi A, Dardenne G, Troccaz J, Burdin V. Bone surface reconstruction and clinical features estimation from sparse landmarks and Statistical Shape Models: a feasibility study on the femur. Med Eng Phys. 2021;95:30-38. [RCA] [PubMed] [DOI] [Full Text] [Cited by in Crossref: 1] [Cited by in RCA: 6] [Article Influence: 1.5] [Reference Citation Analysis (0)] |
| 30. | Rezaei A, Carlson KD, Giambini H, Javid S, Dragomir-Daescu D. Optimizing Accuracy of Proximal Femur Elastic Modulus Equations. Ann Biomed Eng. 2019;47:1391-1399. [RCA] [PubMed] [DOI] [Full Text] [Cited by in Crossref: 8] [Cited by in RCA: 10] [Article Influence: 1.7] [Reference Citation Analysis (0)] |
| 31. | Miura M, Nakamura J, Matsuura Y, Wako Y, Suzuki T, Hagiwara S, Orita S, Inage K, Kawarai Y, Sugano M, Nawata K, Ohtori S. Prediction of fracture load and stiffness of the proximal femur by CT-based specimen specific finite element analysis: cadaveric validation study. BMC Musculoskelet Disord. 2017;18:536. [RCA] [PubMed] [DOI] [Full Text] [Full Text (PDF)] [Cited by in Crossref: 32] [Cited by in RCA: 40] [Article Influence: 5.0] [Reference Citation Analysis (0)] |
| 32. | Jazinizadeh F, Quenneville CE. 3D Analysis of the Proximal Femur Compared to 2D Analysis for Hip Fracture Risk Prediction in a Clinical Population. Ann Biomed Eng. 2021;49:1222-1232. [RCA] [PubMed] [DOI] [Full Text] [Cited by in Crossref: 4] [Cited by in RCA: 8] [Article Influence: 1.6] [Reference Citation Analysis (0)] |


