Copyright
©The Author(s) 2018.
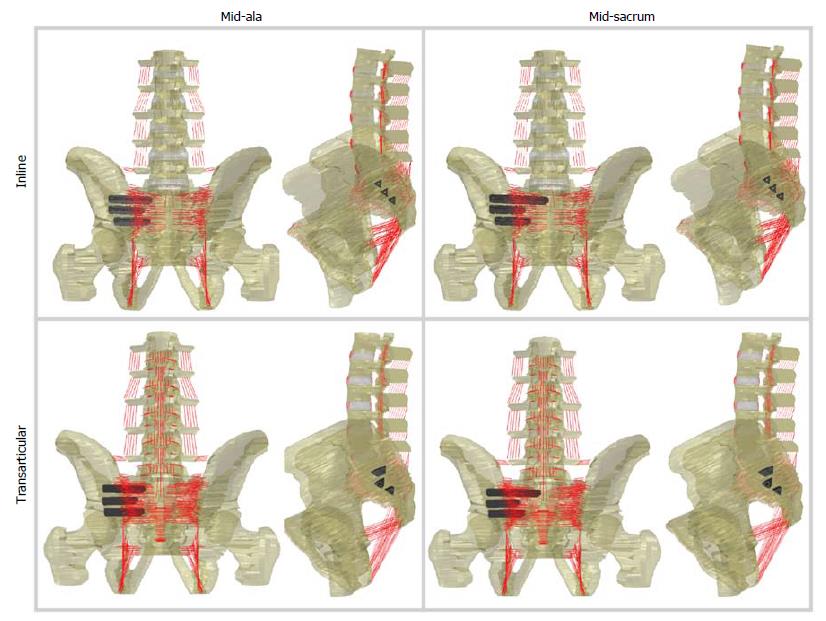
Figure 1 Finite element models tested in this study used either an inline or transarticular orientation.
For models that included a superior implant, the length was varied such that the implant ended above the S1 foramen (mid-ala) or the midline of the sacrum (mid-sacrum).
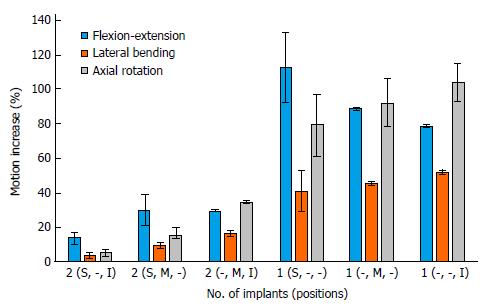
Figure 2 Motion increase (%) for configurations with a reduced number of implants.
The increase for each condition was normalized by the corresponding model that contained 3 implants. Note that a smaller increase in motion represents more reduction in range of motion. S: Superior; M: Middle; I: Inferior. Data is shown as median ± range.
- Citation: Lindsey DP, Kiapour A, Yerby SA, Goel VK. Sacroiliac joint stability: Finite element analysis of implant number, orientation, and superior implant length. World J Orthop 2018; 9(3): 14-23
- URL: https://www.wjgnet.com/2218-5836/full/v9/i3/14.htm
- DOI: https://dx.doi.org/10.5312/wjo.v9.i3.14


