Copyright
©The Author(s) 2017.
World J Orthop. Sep 18, 2017; 8(9): 705-709
Published online Sep 18, 2017. doi: 10.5312/wjo.v8.i9.705
Published online Sep 18, 2017. doi: 10.5312/wjo.v8.i9.705
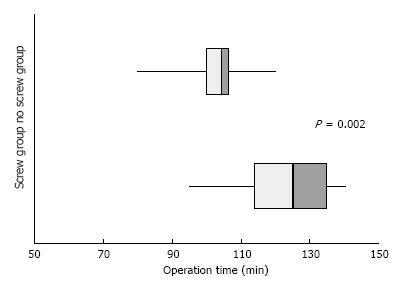
Figure 1 A bar diagram showing operation time and groups.
Comparison of operation time between screw and no-screw groups with P values illustrated to show differences.
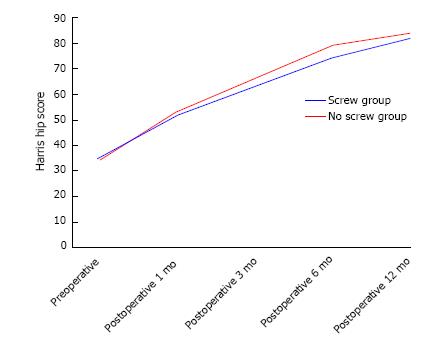
Figure 2 A line chart showing changes Harris hip score over time.
- Citation: Pepe M, Kocadal O, Erener T, Ceritoglu K, Aksahin E, Aktekin CN. Acetabular components with or without screws in total hip arthroplasty. World J Orthop 2017; 8(9): 705-709
- URL: https://www.wjgnet.com/2218-5836/full/v8/i9/705.htm
- DOI: https://dx.doi.org/10.5312/wjo.v8.i9.705


