Copyright
©The Author(s) 2017.
World J Orthop. Apr 18, 2017; 8(4): 322-328
Published online Apr 18, 2017. doi: 10.5312/wjo.v8.i4.322
Published online Apr 18, 2017. doi: 10.5312/wjo.v8.i4.322
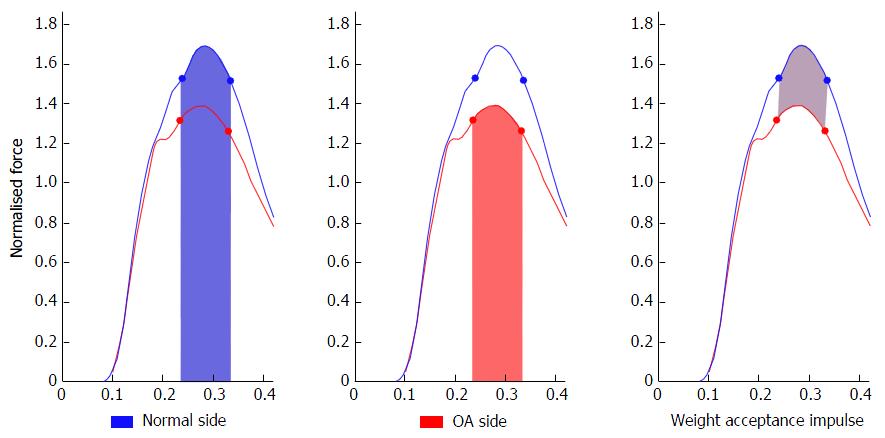
Figure 1 Impulse analysis during weight acceptance: Comparing the knee osteoarthritis limb to the contralateral normal side.
OA: Osteoarthritis.
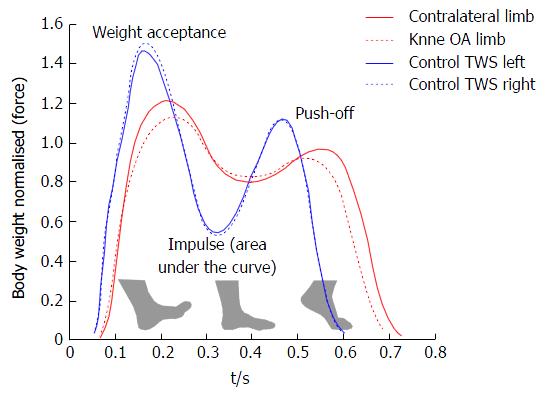
Figure 2 Mean gait patterns during stance phase of controls (blue) and knee osteoarthritis patients (red) at their top walking speed.
OA: Osteoarthritis; TWS: Top walking speed.
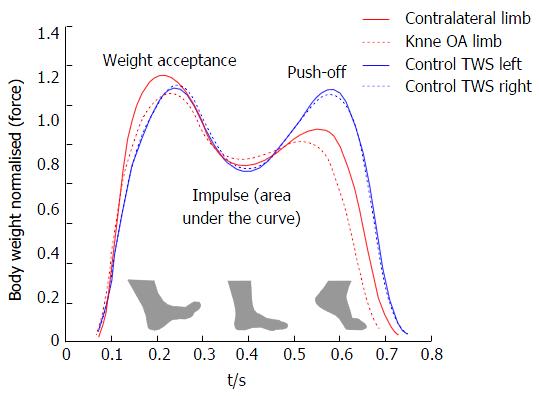
Figure 3 Mean gait patterns during stance phase of controls (blue) and knee osteoarthritis patients (red) at similar speeds.
OA: Osteoarthritis; TWS: Top walking speed.
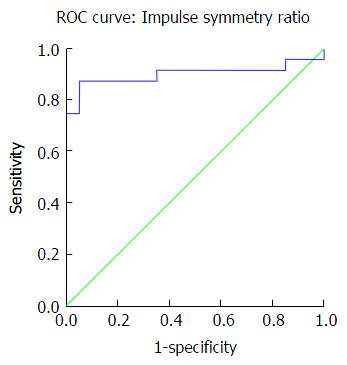
Figure 4 Receiver operating characteristics graph: Displaying the discriminating ability of total impulse symmetry ratio.
ROC: Receiver operating characteristics.
- Citation: Wiik AV, Aqil A, Brevadt M, Jones G, Cobb J. Abnormal ground reaction forces lead to a general decline in gait speed in knee osteoarthritis patients. World J Orthop 2017; 8(4): 322-328
- URL: https://www.wjgnet.com/2218-5836/full/v8/i4/322.htm
- DOI: https://dx.doi.org/10.5312/wjo.v8.i4.322


