Copyright
©The Author(s) 2017.
World J Orthop. Feb 18, 2017; 8(2): 130-141
Published online Feb 18, 2017. doi: 10.5312/wjo.v8.i2.130
Published online Feb 18, 2017. doi: 10.5312/wjo.v8.i2.130
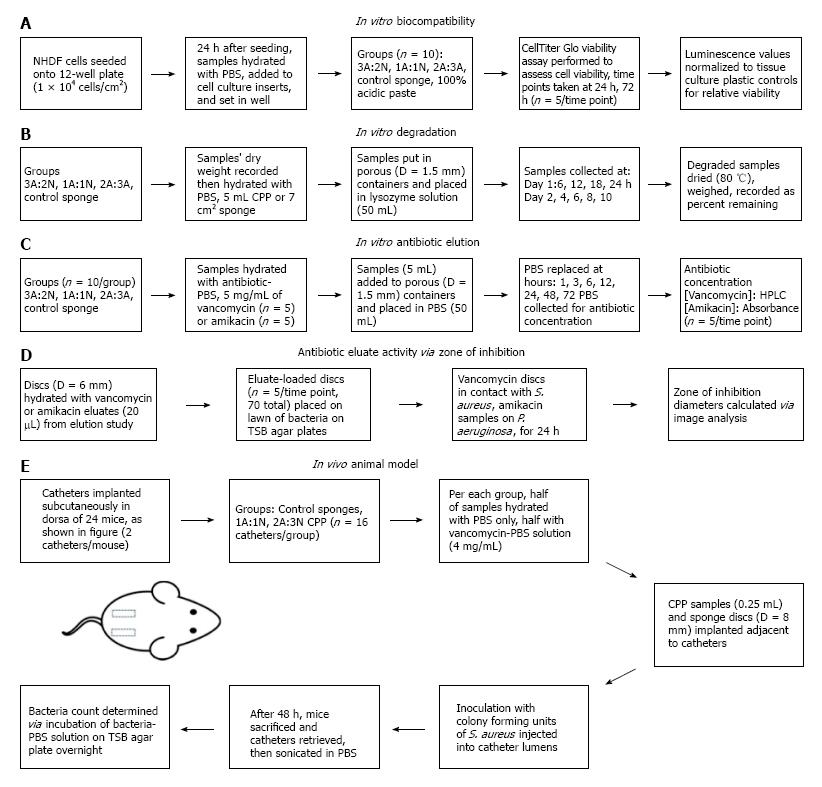
Figure 1 Experimental design flowchart detailing methods for the following studies.
A: Biocompatibility; B: Degradation; C: Antibiotic elution; D: Antibiotic eluate activity; E: In vivo functional model. NHDF: Normal human dermal fibroblast; PBS: Phosphate buffered saline; CPP: Chitosan/polyethylene glycol paste; TSB: Trypticase soy broth.
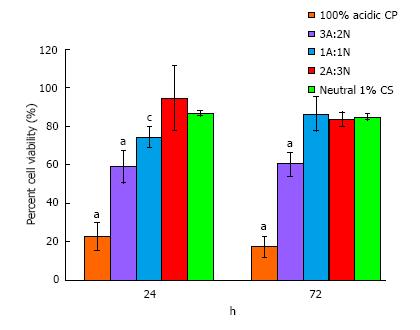
Figure 2 In vitro direct contact biocompatibility normalized to tissue culture plastic control reported as the average ± standard deviation of percent cell viability for 100% acidic chitosan paste, 3A:2N, 1A:1N, and 2A:3N chitosan/polyethylene glycol paste variations, and neutral 1% chitosan sponges after 24 and 72 h (n = 5).
(aP < 0.05 vs all at respective time point, cP < 0.05 vs 2A:3N CPP and neutral 1% CS at respective time point). CPP: Chitosan/polyethylene glycol paste.
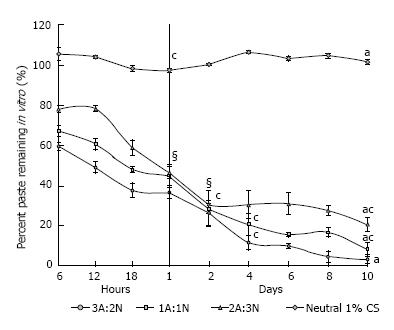
Figure 3 In vitro enzymatic degradation reported as the average ± standard deviation of weight percent remaining of the sample for 3A:2N, 1A:1N, and 2A:3N chitosan/ polyethylene glycol paste variations and neutral 1% chitosan sponges over 10 d (n = 5).
aP < 0.05 vs each other at all time points except § for all pastes at day 2 and 2A:3N and 1A:1N at day 1; cP < 0.05 showing significant degradation through marked time points.
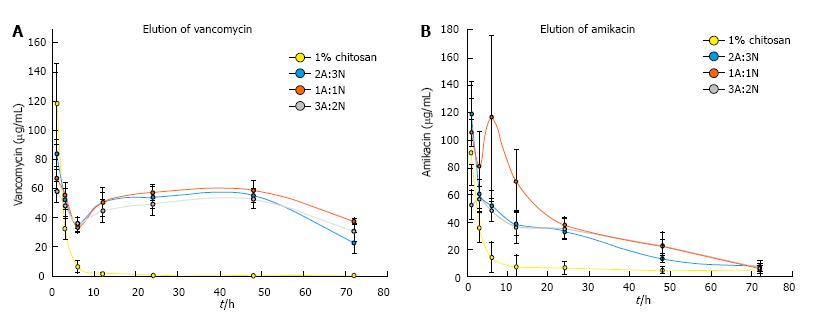
Figure 4 In vitro release of antibiotics, vancomycin elution group (A), and Amikacin elution group (B), from 3A:2N, 1A:1N, and 2A:3N chitosan/polyethylene glycol paste variations and neutral 1% chitosan sponges over 72 h reported as the average ± standard deviation in concentration of antibiotic in sample retrieved.
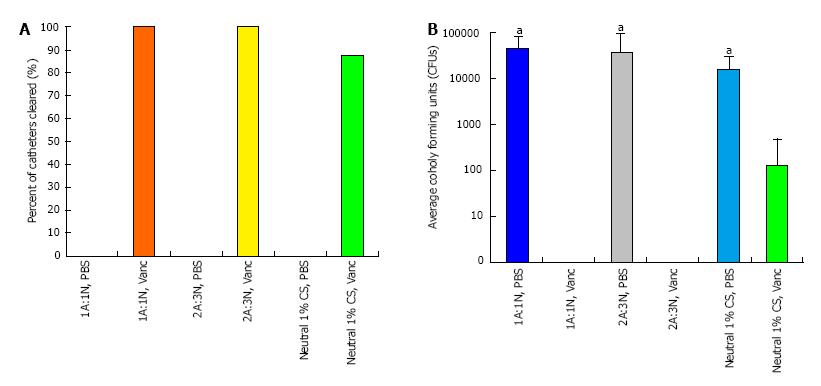
Figure 5 Percentage of catheters cleared (A) and average Staphylococcus aureus colony (B) forming units per catheter for those retrieved from mice treated with 1A:1N and 2A:3N chitosan/polyethylene glycol paste variations and neutral 1% chitosan sponges over 48 h (n = 8, 2 catheters per mouse).
All samples were loaded with either PBS alone or 4 mg/mL of vancomycin. aP < 0.05 vs all vancomycin samples. PBS: Phosphate buffered saline; CPP: Chitosan/polyethylene glycol paste.
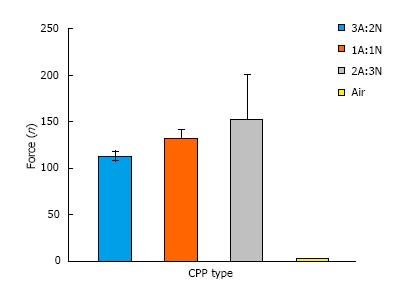
Figure 6 Ejection results represented as the average ± standard deviation of force required to eject air and 3A:2N, 1A:1N, and 2A:3N chitosan/polyethylene glycol paste variations from a syringe (n = 3).
CPP: Chitosan/polyethylene glycol paste.
- Citation: Rhodes CS, Alexander CM, Berretta JM, Courtney HS, Beenken KE, Smeltzer MS, Bumgardner JD, Haggard WO, Jennings JA. Evaluation of a chitosan-polyethylene glycol paste as a local antibiotic delivery device. World J Orthop 2017; 8(2): 130-141
- URL: https://www.wjgnet.com/2218-5836/full/v8/i2/130.htm
- DOI: https://dx.doi.org/10.5312/wjo.v8.i2.130


