Copyright
©The Author(s) 2015.
World J Orthop. Sep 18, 2015; 6(8): 567-576
Published online Sep 18, 2015. doi: 10.5312/wjo.v6.i8.567
Published online Sep 18, 2015. doi: 10.5312/wjo.v6.i8.567
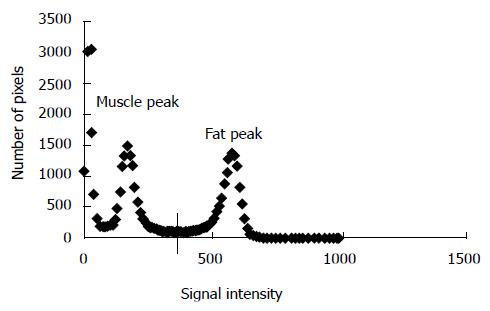
Figure 1 Histogram analysis of the whole thigh region representing both muscle (left) and fat (right) peaks as well as the mid-point signal intensity that is used a cut-off point to separate between muscle or inter-intra-muscular fat pixels.
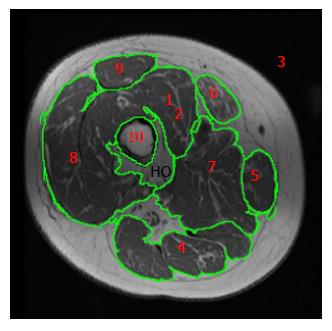
Figure 2 A representative transaxial magnetic resonance imaging of the mid-thigh of a T4 individual with complete spinal cord injury representing different region of interests.
Note the white adipose tissue infiltrated between individual muscle groups IMF as well as the white adipose tissue infiltrated within individual muscle IMF. We have collectively referred to both of them as IMF. Also note the HO extended from the bone marrow. 1Three vasti muscles (m); 2Vastus intermedius (m); 3Image background; 4Hamstrings (m); 5Gracilis (m); 6Sartorius (m); 7Adductors (m); 8Vastus lateralis (m); 9Rectus femoris (m); 10Cortical bone and bone marrow. IMF: Interamuscular fat; HO: Heterotrophic ossification.
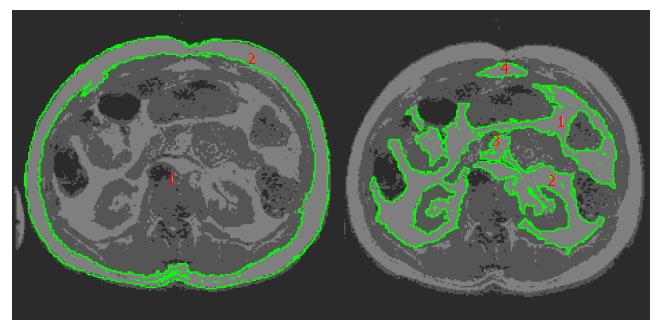
Figure 3 A representative magnetic resonance imaging analysis of subcutaneous and visceral adipose tissues in a person with spinal cord injury.
Note the tracing of visceral adipose tissue within the region of interest. The numbers 1, 2, 3 and 4 refer to the visceral fat (VAT) cross-sectional areas of disconnected regions. These 4 regions are later summed to have the total VAT area in the entire region. VAT: Visceral adipose tissue.
- Citation: Gorgey AS, Wells KM, Austin TL. Adiposity and spinal cord injury. World J Orthop 2015; 6(8): 567-576
- URL: https://www.wjgnet.com/2218-5836/full/v6/i8/567.htm
- DOI: https://dx.doi.org/10.5312/wjo.v6.i8.567


