Copyright
©The Author(s) 2025.
World J Orthop. Jun 18, 2025; 16(6): 105068
Published online Jun 18, 2025. doi: 10.5312/wjo.v16.i6.105068
Published online Jun 18, 2025. doi: 10.5312/wjo.v16.i6.105068
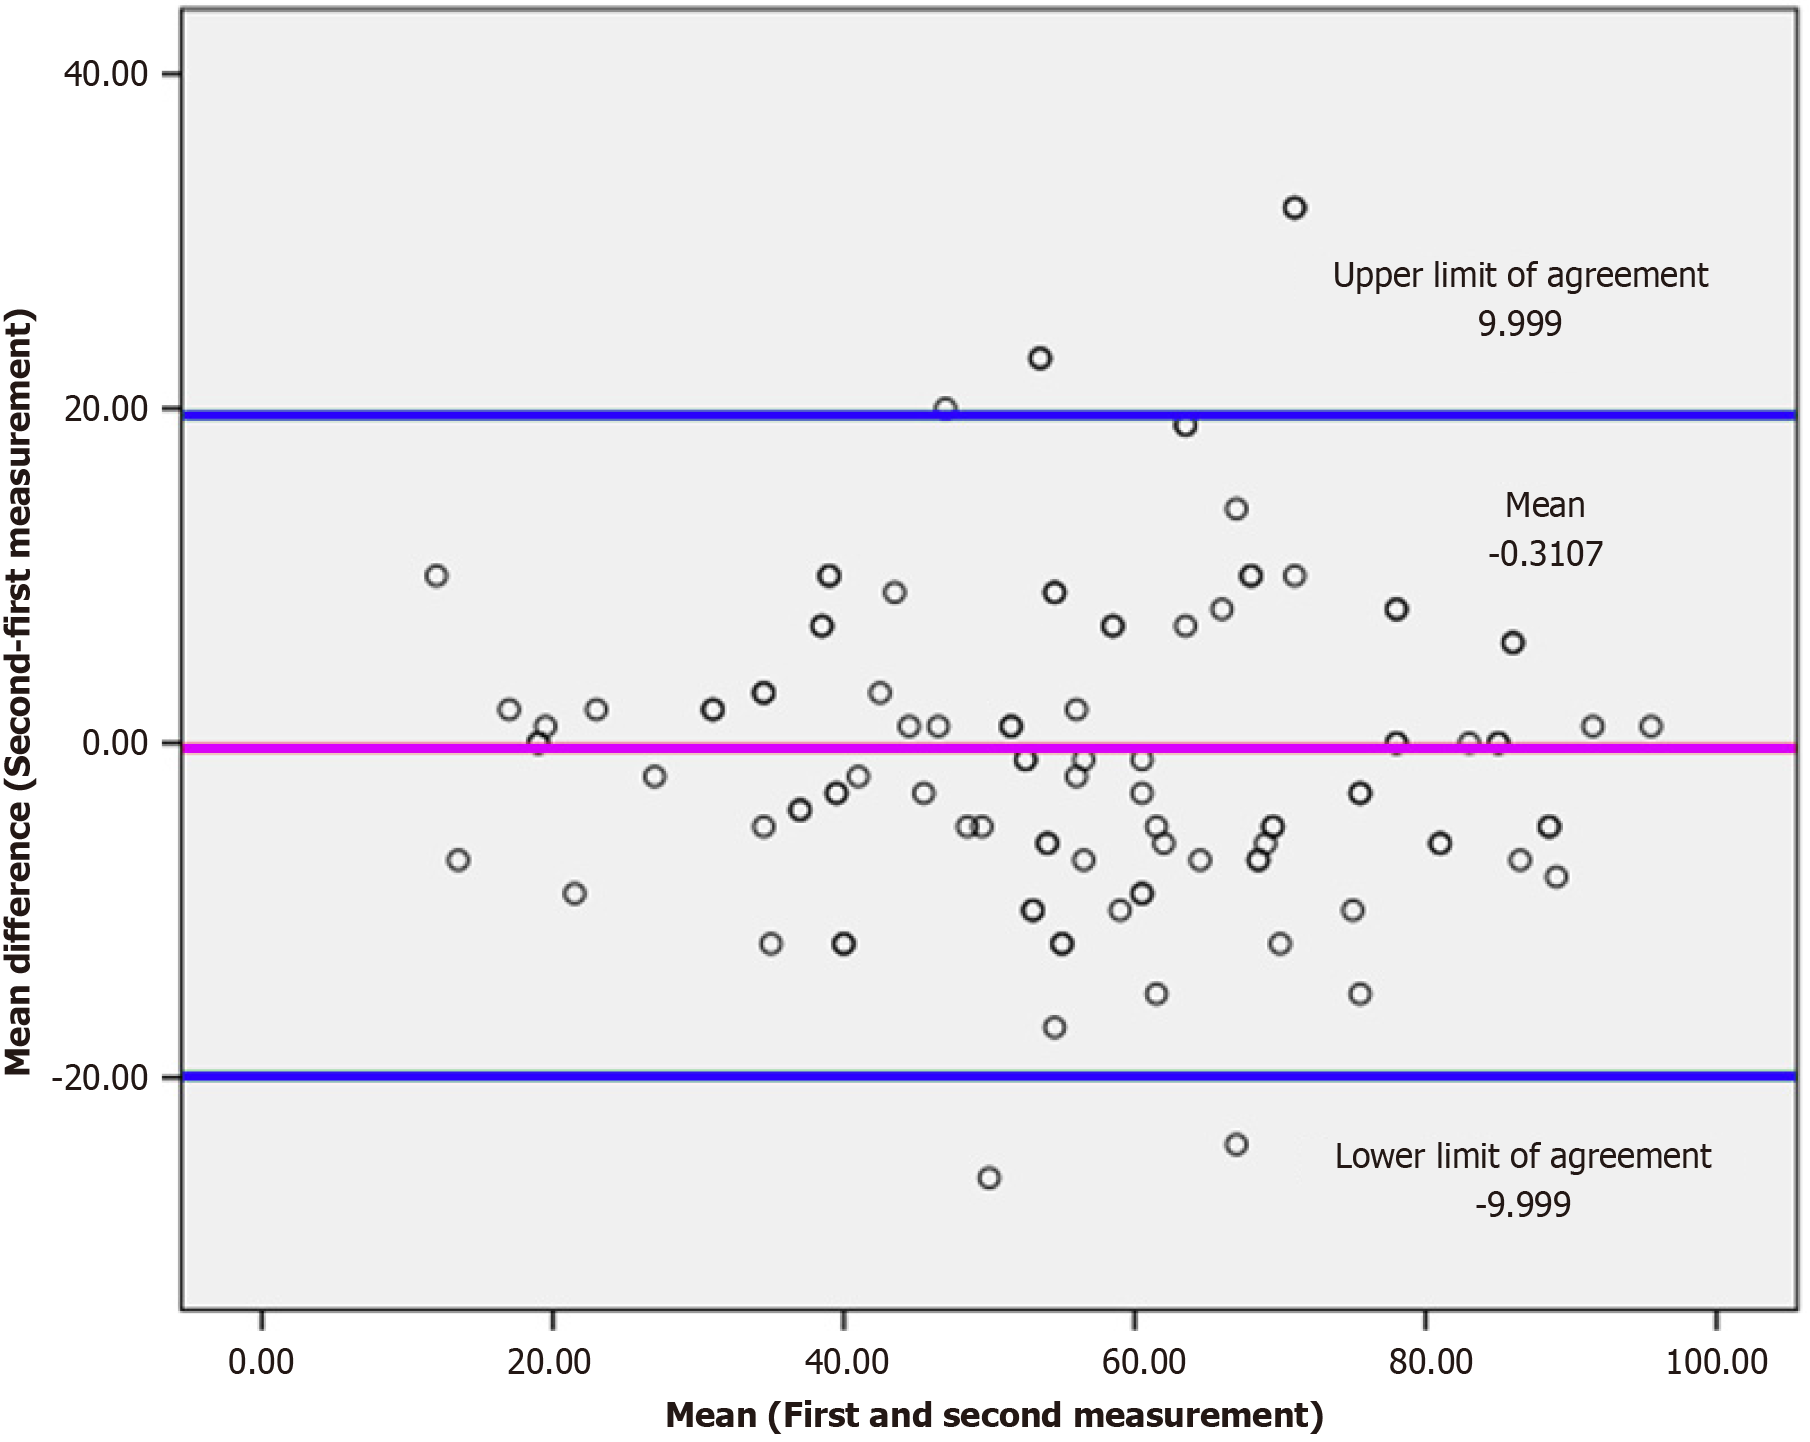
Figure 1
Bland-Altman plot visualizing the agreement for test-retest measurement.
Limits of agreement: Mean difference (pink line) ± SD × 1.96 (blue lines) in points for a 100-point scale.
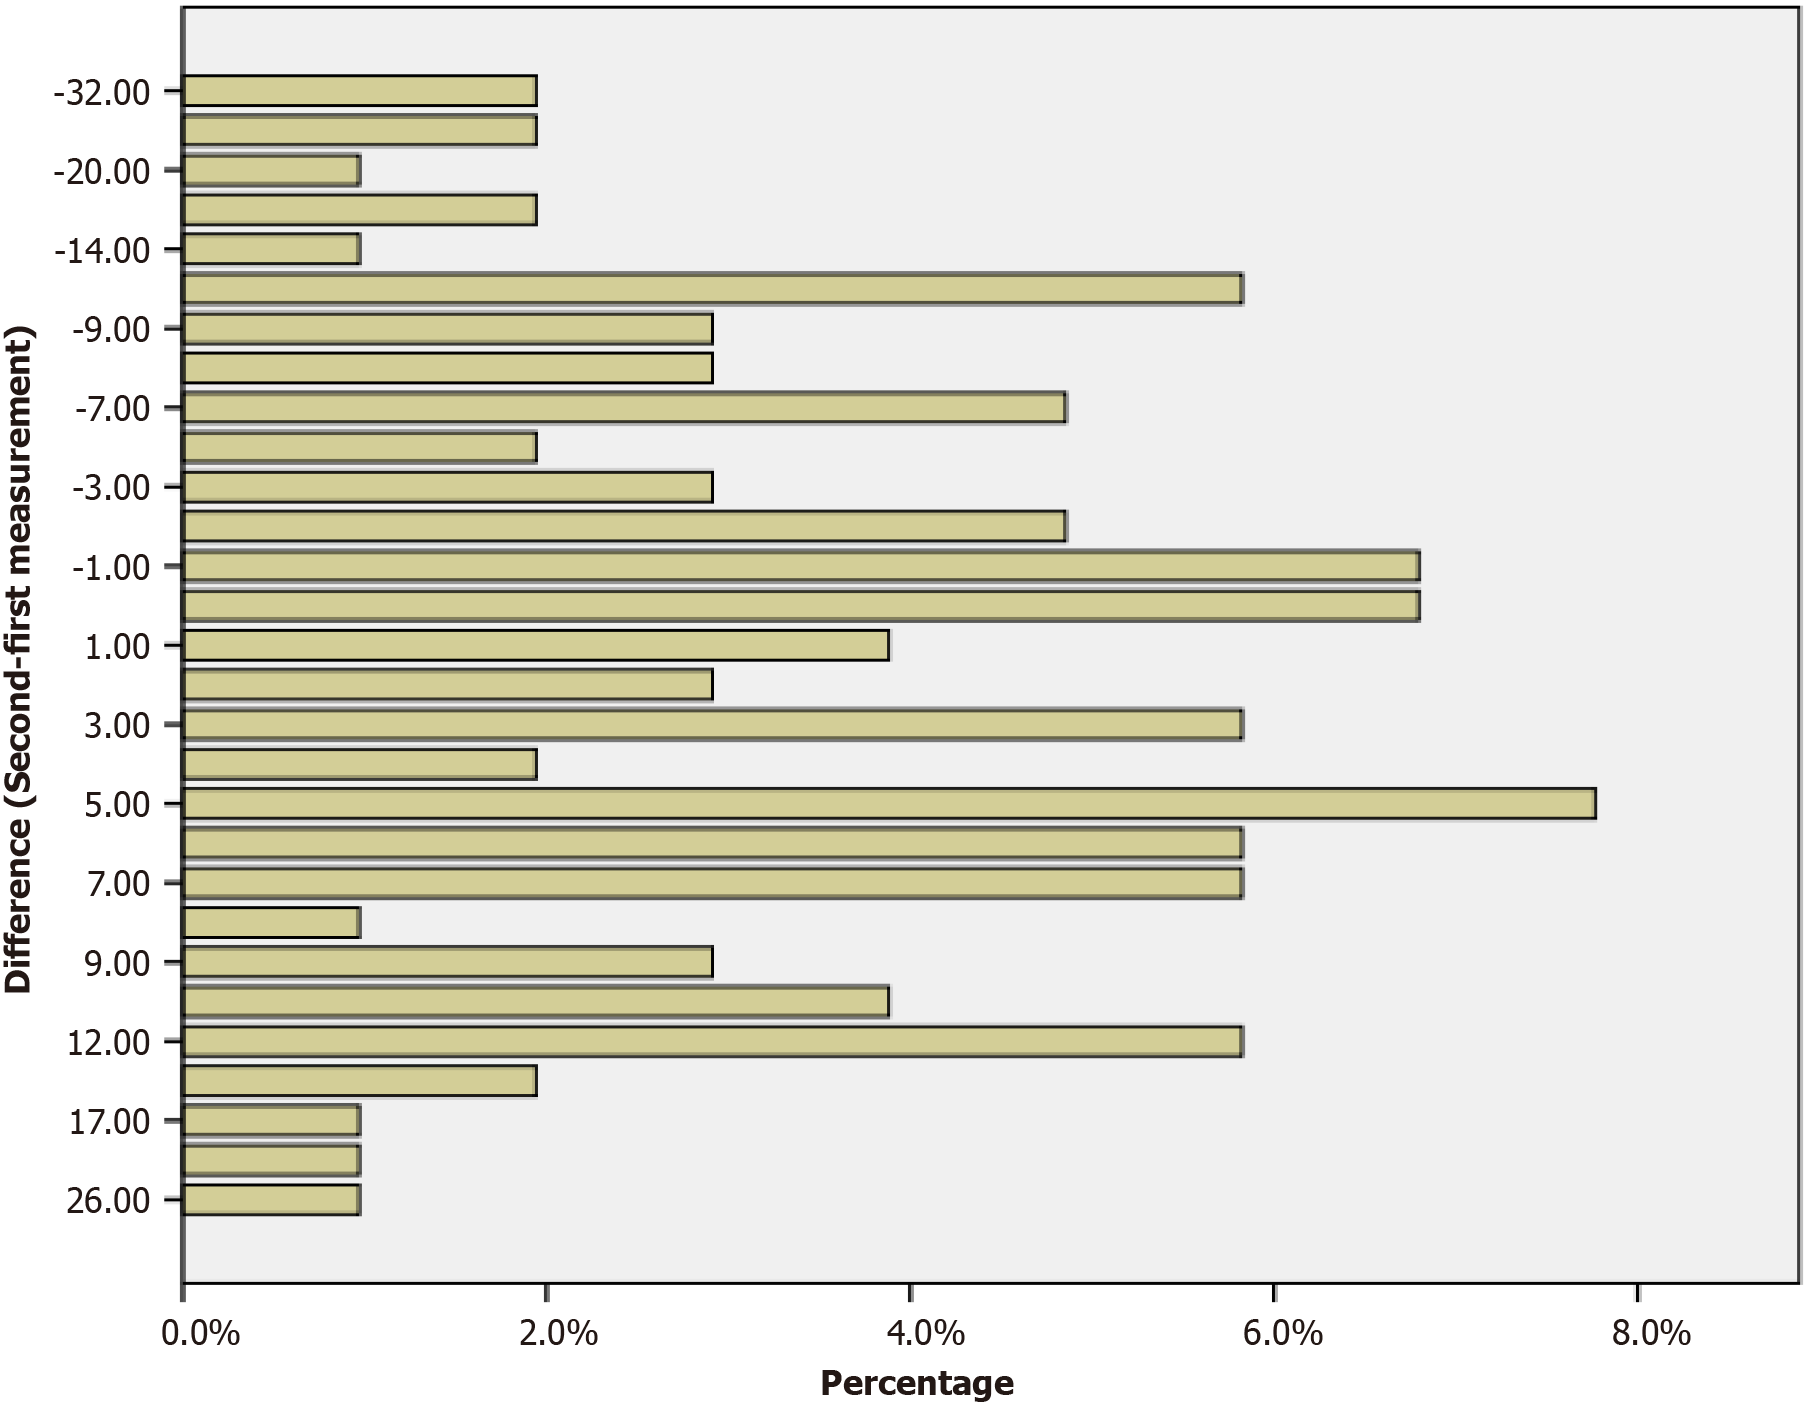
Figure 2
Bar chart showing the percentage of the sample corresponding to the difference between each pair of measurements (second-first measurement).
- Citation: Chamorro-Moriana G, Espuny-Ruiz F, Ridao-Fernandez C, Magni E. Validation of “Victorian institute of sports assessment for patellar tendons” in patellofemoral pain: Reliability, interpretability and feasibility study. World J Orthop 2025; 16(6): 105068
- URL: https://www.wjgnet.com/2218-5836/full/v16/i6/105068.htm
- DOI: https://dx.doi.org/10.5312/wjo.v16.i6.105068


