Copyright
©The Author(s) 2024.
World J Orthop. Feb 18, 2024; 15(2): 192-200
Published online Feb 18, 2024. doi: 10.5312/wjo.v15.i2.192
Published online Feb 18, 2024. doi: 10.5312/wjo.v15.i2.192
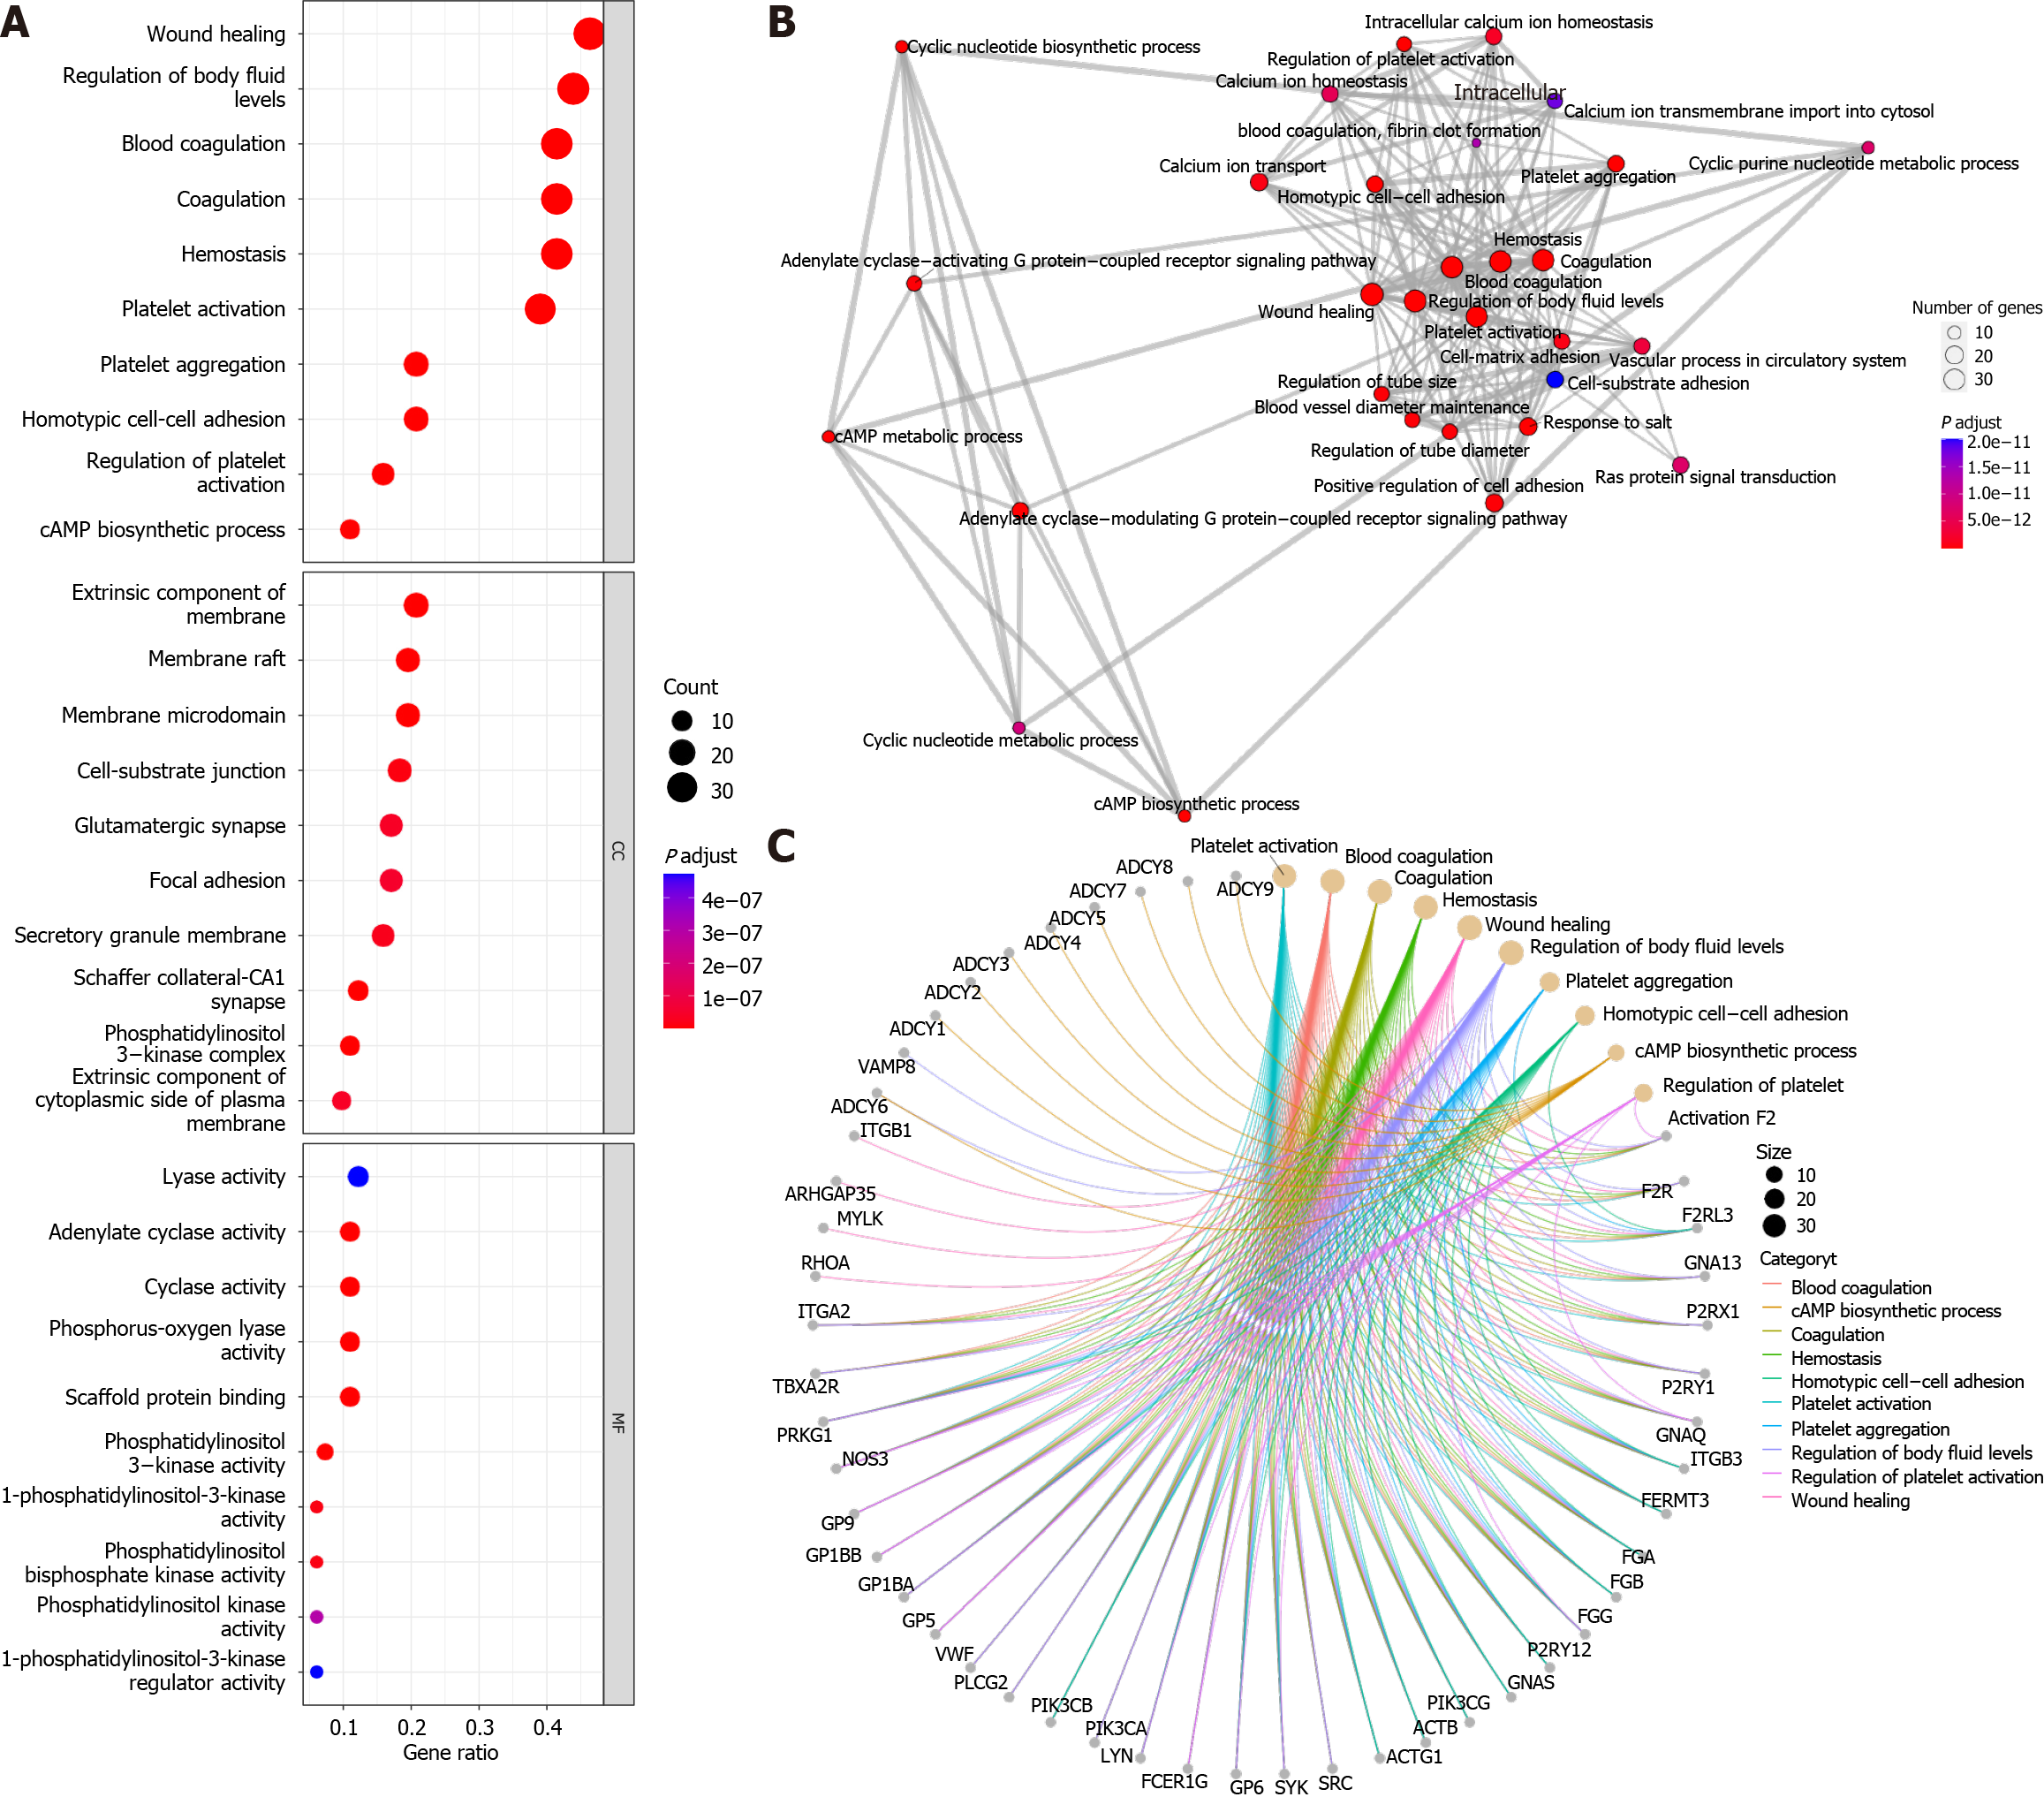
Figure 1 Gene ontology enrichment analysis of 96 platelet activation-associated genes.
A: Bubble plot of gene ontology (GO) functional enrichment analysis; B: Association network between GO terms that were enriched; C: Enrichment maps between GO terms and genes.
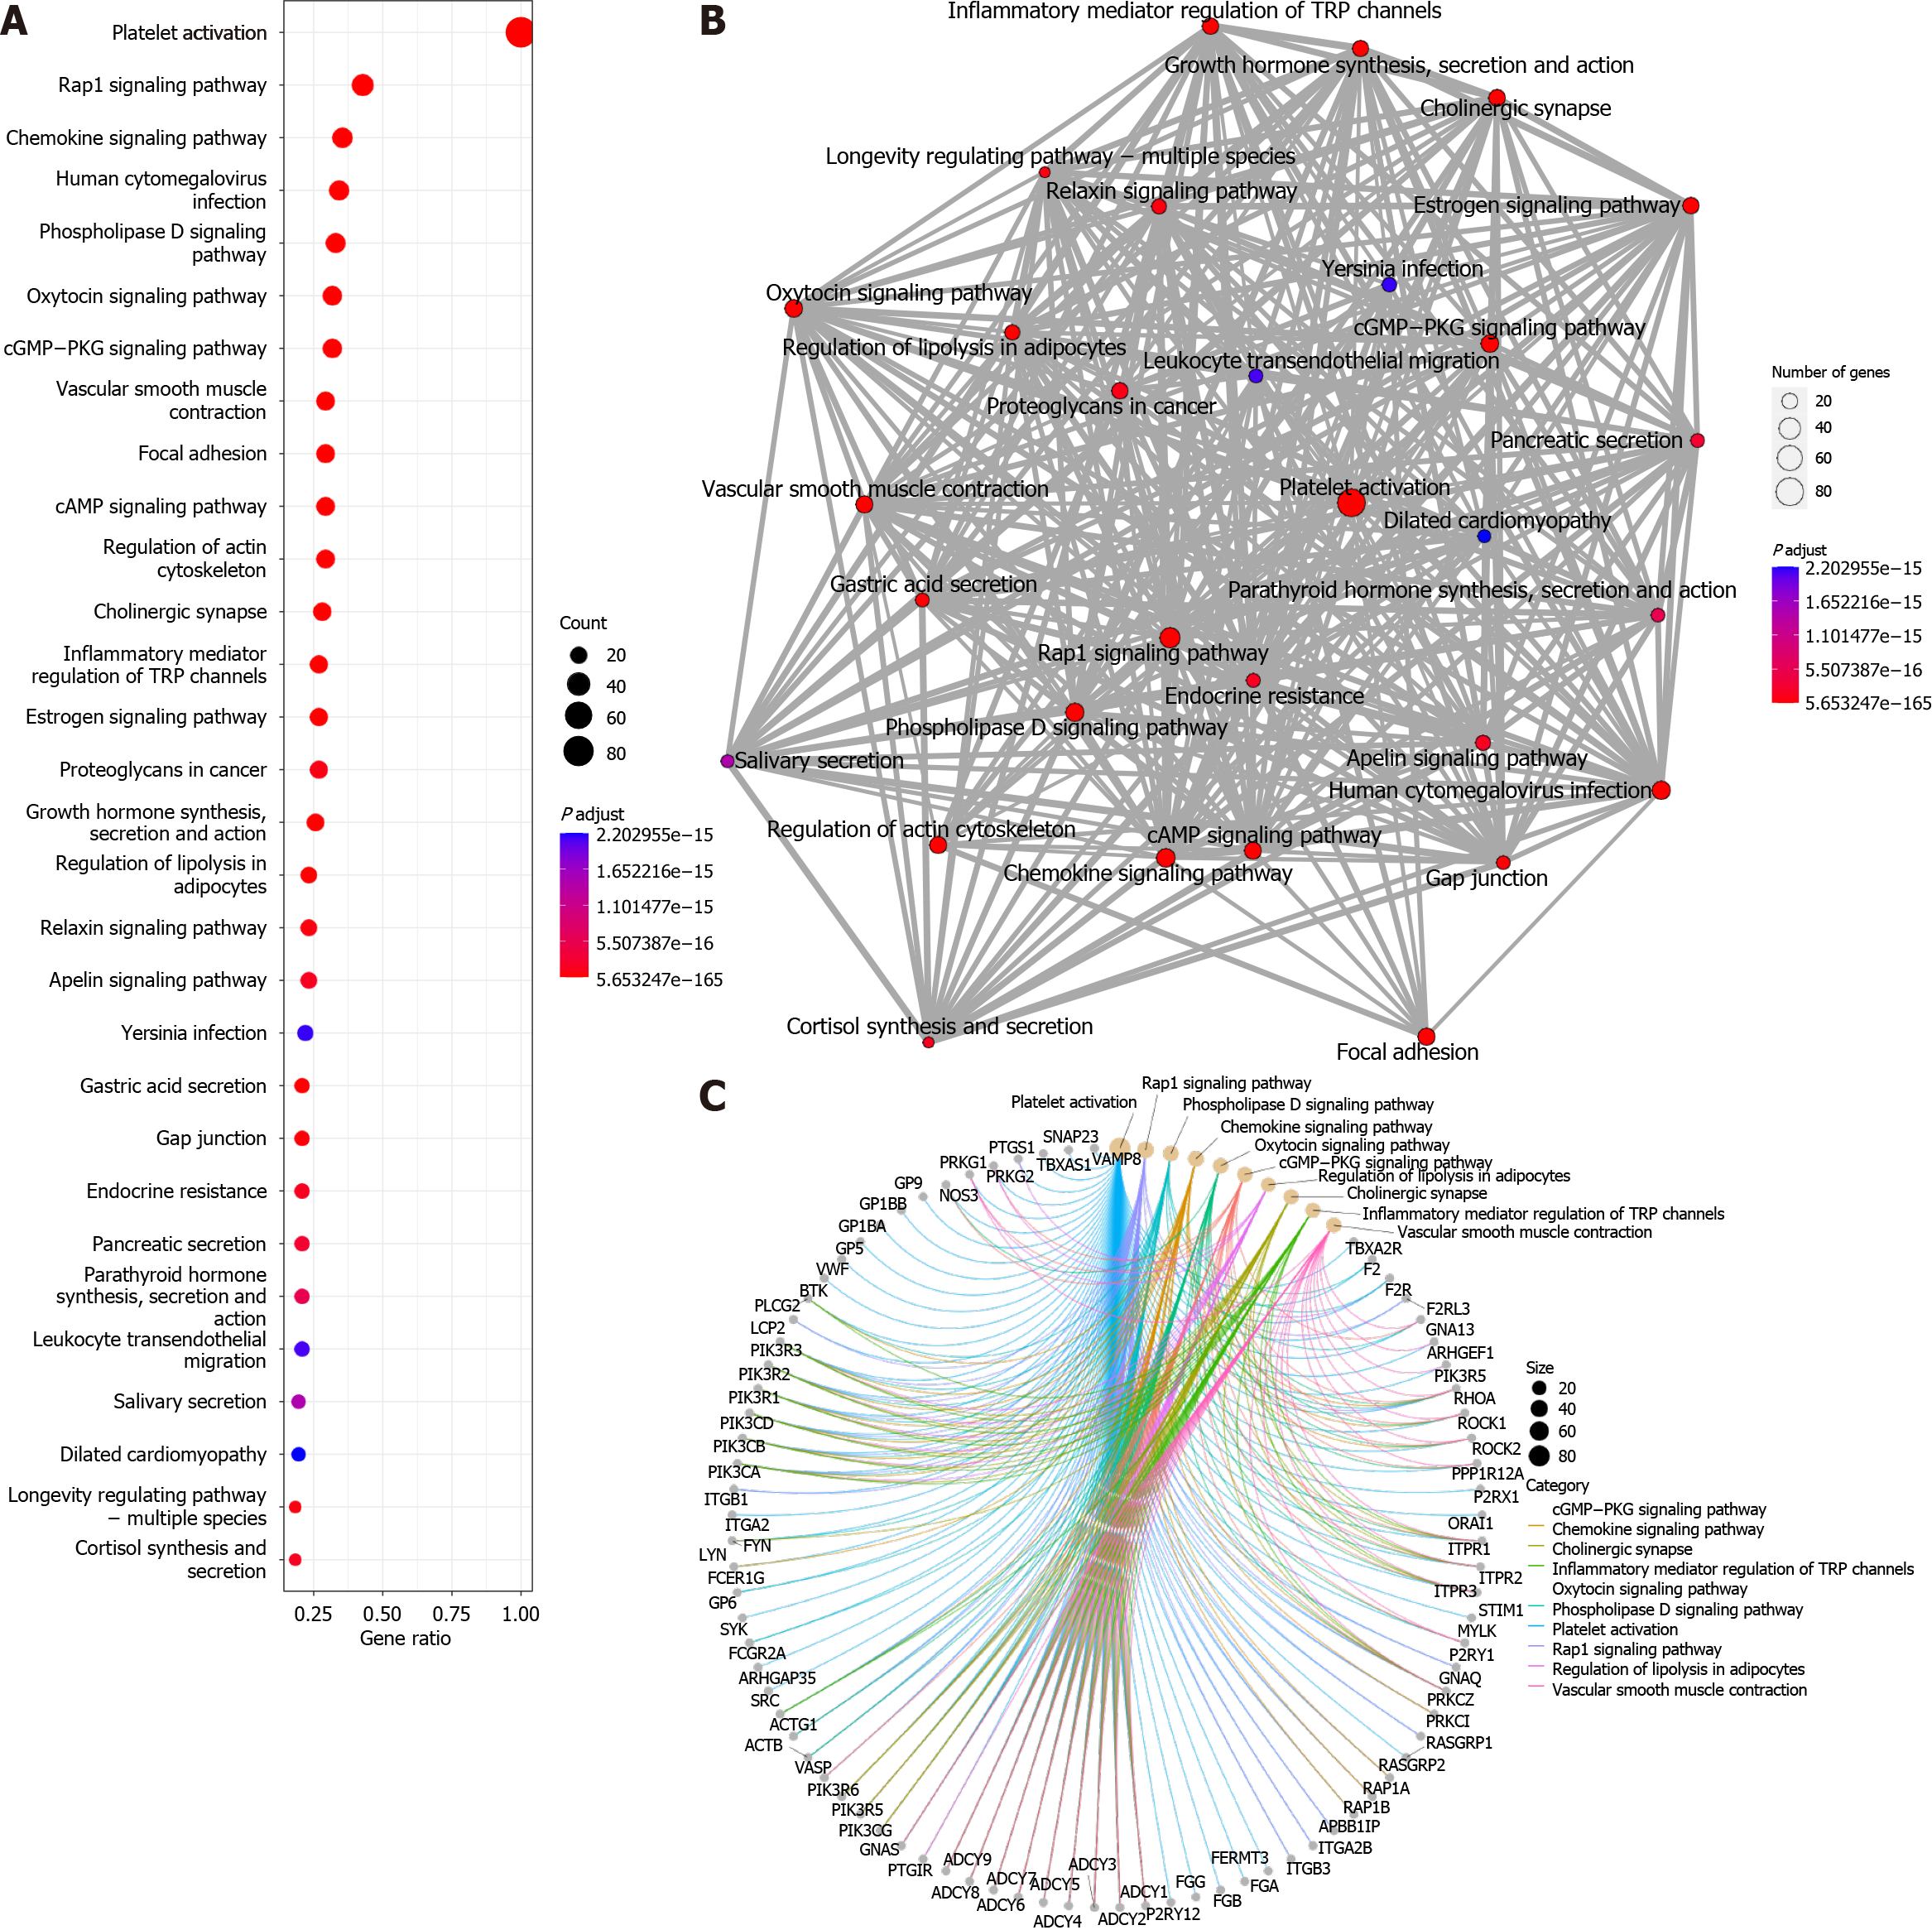
Figure 2 Kyoto Encyclopedia of Genes and Genomes enrichment analysis of 96 platelet activation-associated genes.
A: Bubble plot of the Kyoto Encyclopedia of Genes and Genomes (KEGG) pathway enrichment analysis; B: Association network between KEGG pathways that were enriched; C: Enrichment maps between KEGG signalling pathways and genes.
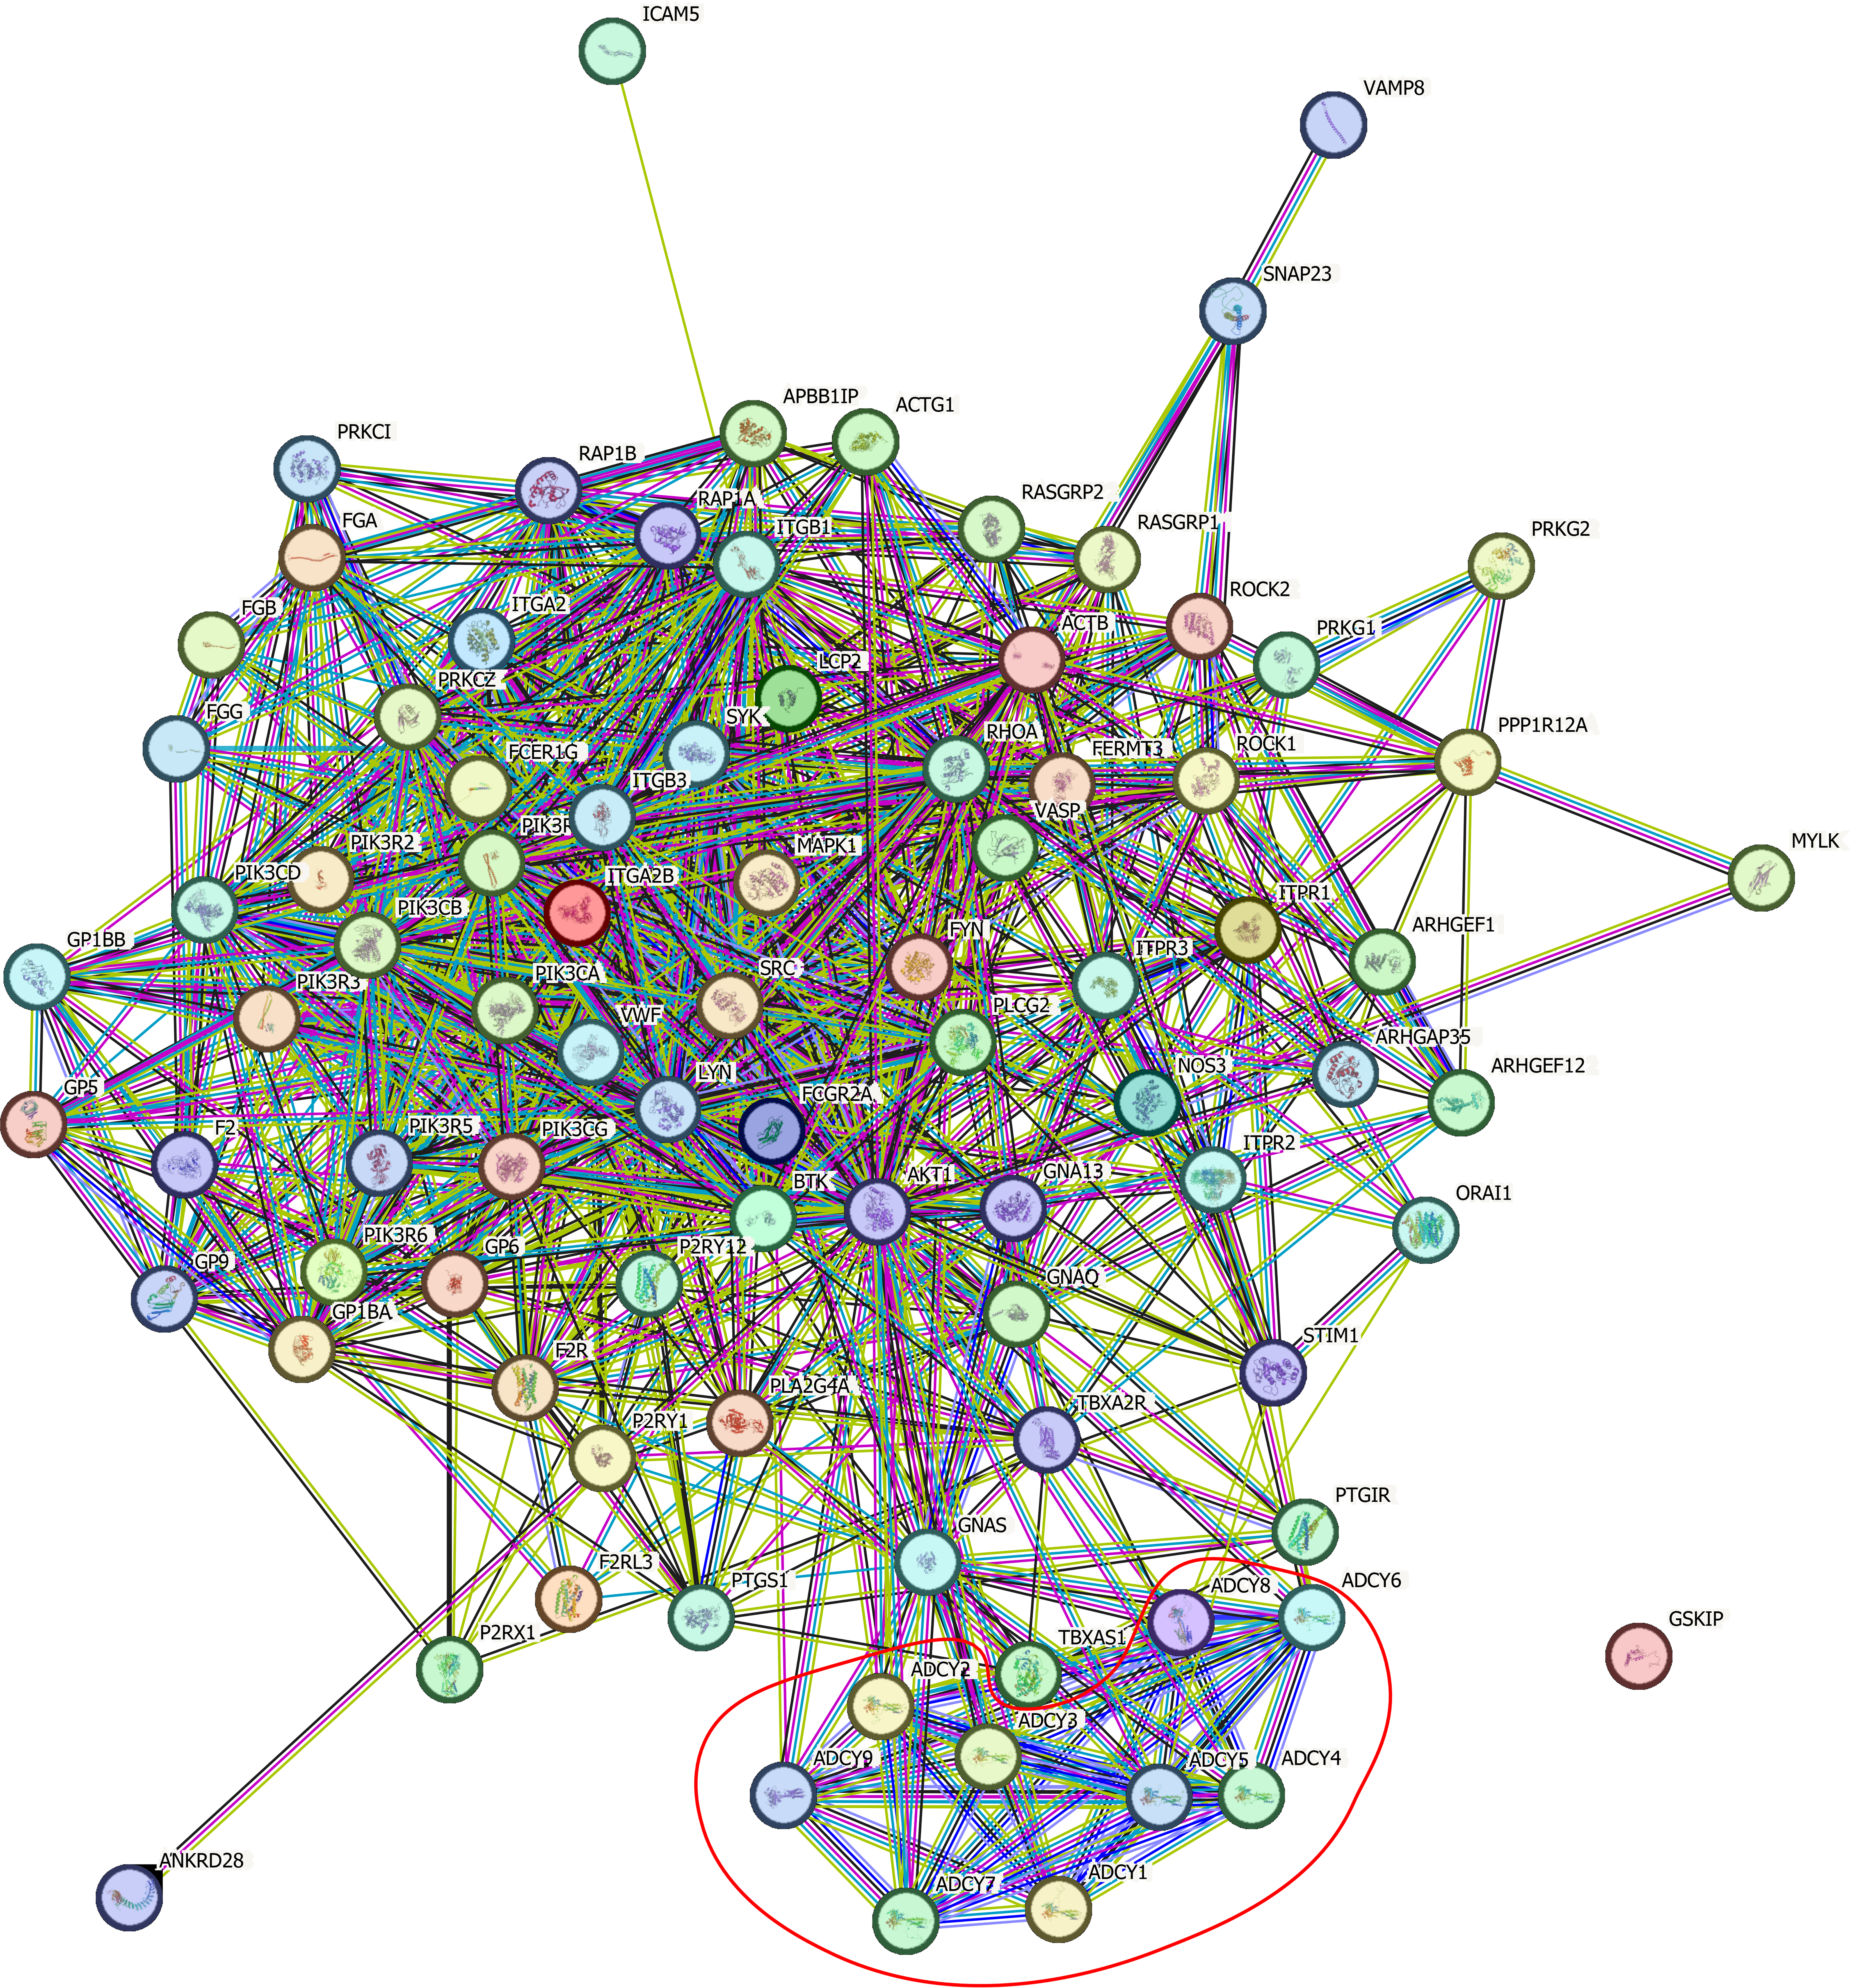
Figure 3 Protein-protein interaction network of 96 platelet activation-related genes.
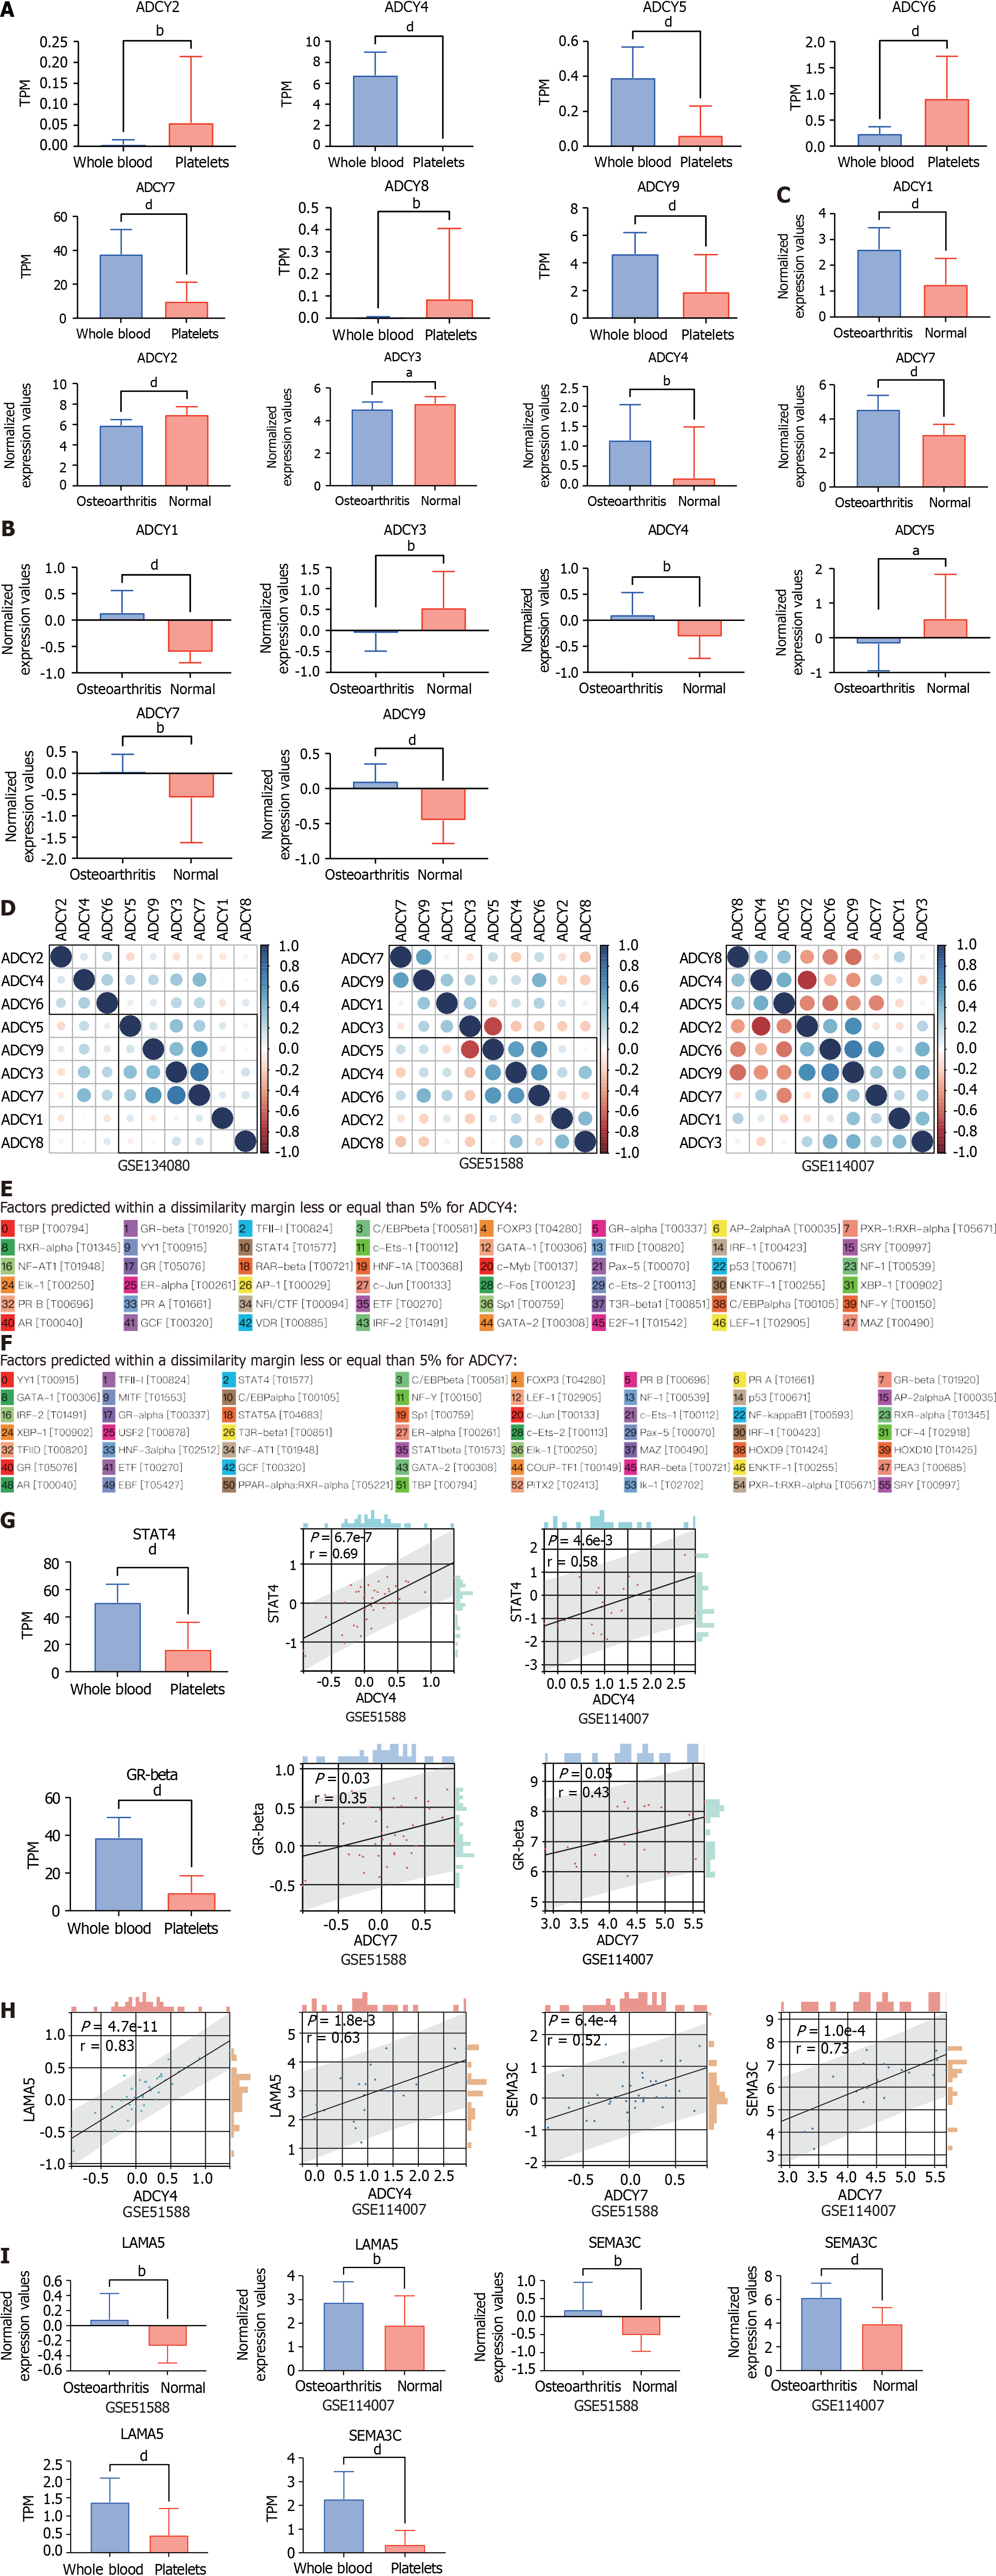
Figure 4 The STAT4-ADCY4-LAMA5 axis and the GRbeta-ADCY7-SEMA3C axis are either key to osteoarthritic diseases.
A: Differential expression levels of adenylate cyclase in platelets and whole blood (data from GSE178158, GSE134080 cohorts); B: Differential expression levels of adenylate cyclase in platelets and whole blood (data from GSE51588 cohort); C: Adenylate cyclase expression level difference exists in platelets and whole blood (data from GSE114007 cohort); D: There is a very strong correlation between the expression level of adenylate cyclase (left: GSE134080 cohort, center: GSE51588 cohort, right: GSE114007 cohort); E: Can be combined with the ADCY4 promoter region; F: Transcription factors that can bind to ADCY7 promoter region; G: There is an extremely strong positive correlation between STAT4 and ADCY4 expression levels, and between GR-beta and ADCY7 expression levels; H: There is an extremely strong positive correlation between LAMA5 and ADCY4 expression levels, and between SEMA3C and ADCY7 expression levels; I: Both LAMA5 and SEMA3C were highly expressed in osteoarthritic disease samples. aP < 0.05, bP < 0.01, cP < 0.001, and dP < 0.0001.
- Citation: Sun JY, Li C, Du FY. Adenylate cyclase activates the cAMP signalling pathway to enhance platelet-rich plasma-treated Achilles tendon disease, a theoretical bioinformatics-based study. World J Orthop 2024; 15(2): 192-200
- URL: https://www.wjgnet.com/2218-5836/full/v15/i2/192.htm
- DOI: https://dx.doi.org/10.5312/wjo.v15.i2.192


