
















Copyright: ©Author(s) 2026.
World J Clin Oncol. Nov 24, 2026; 17(11): 126582
Published online Nov 24, 2026. doi: 10.5306/wjco.126582
Published online Nov 24, 2026. doi: 10.5306/wjco.126582
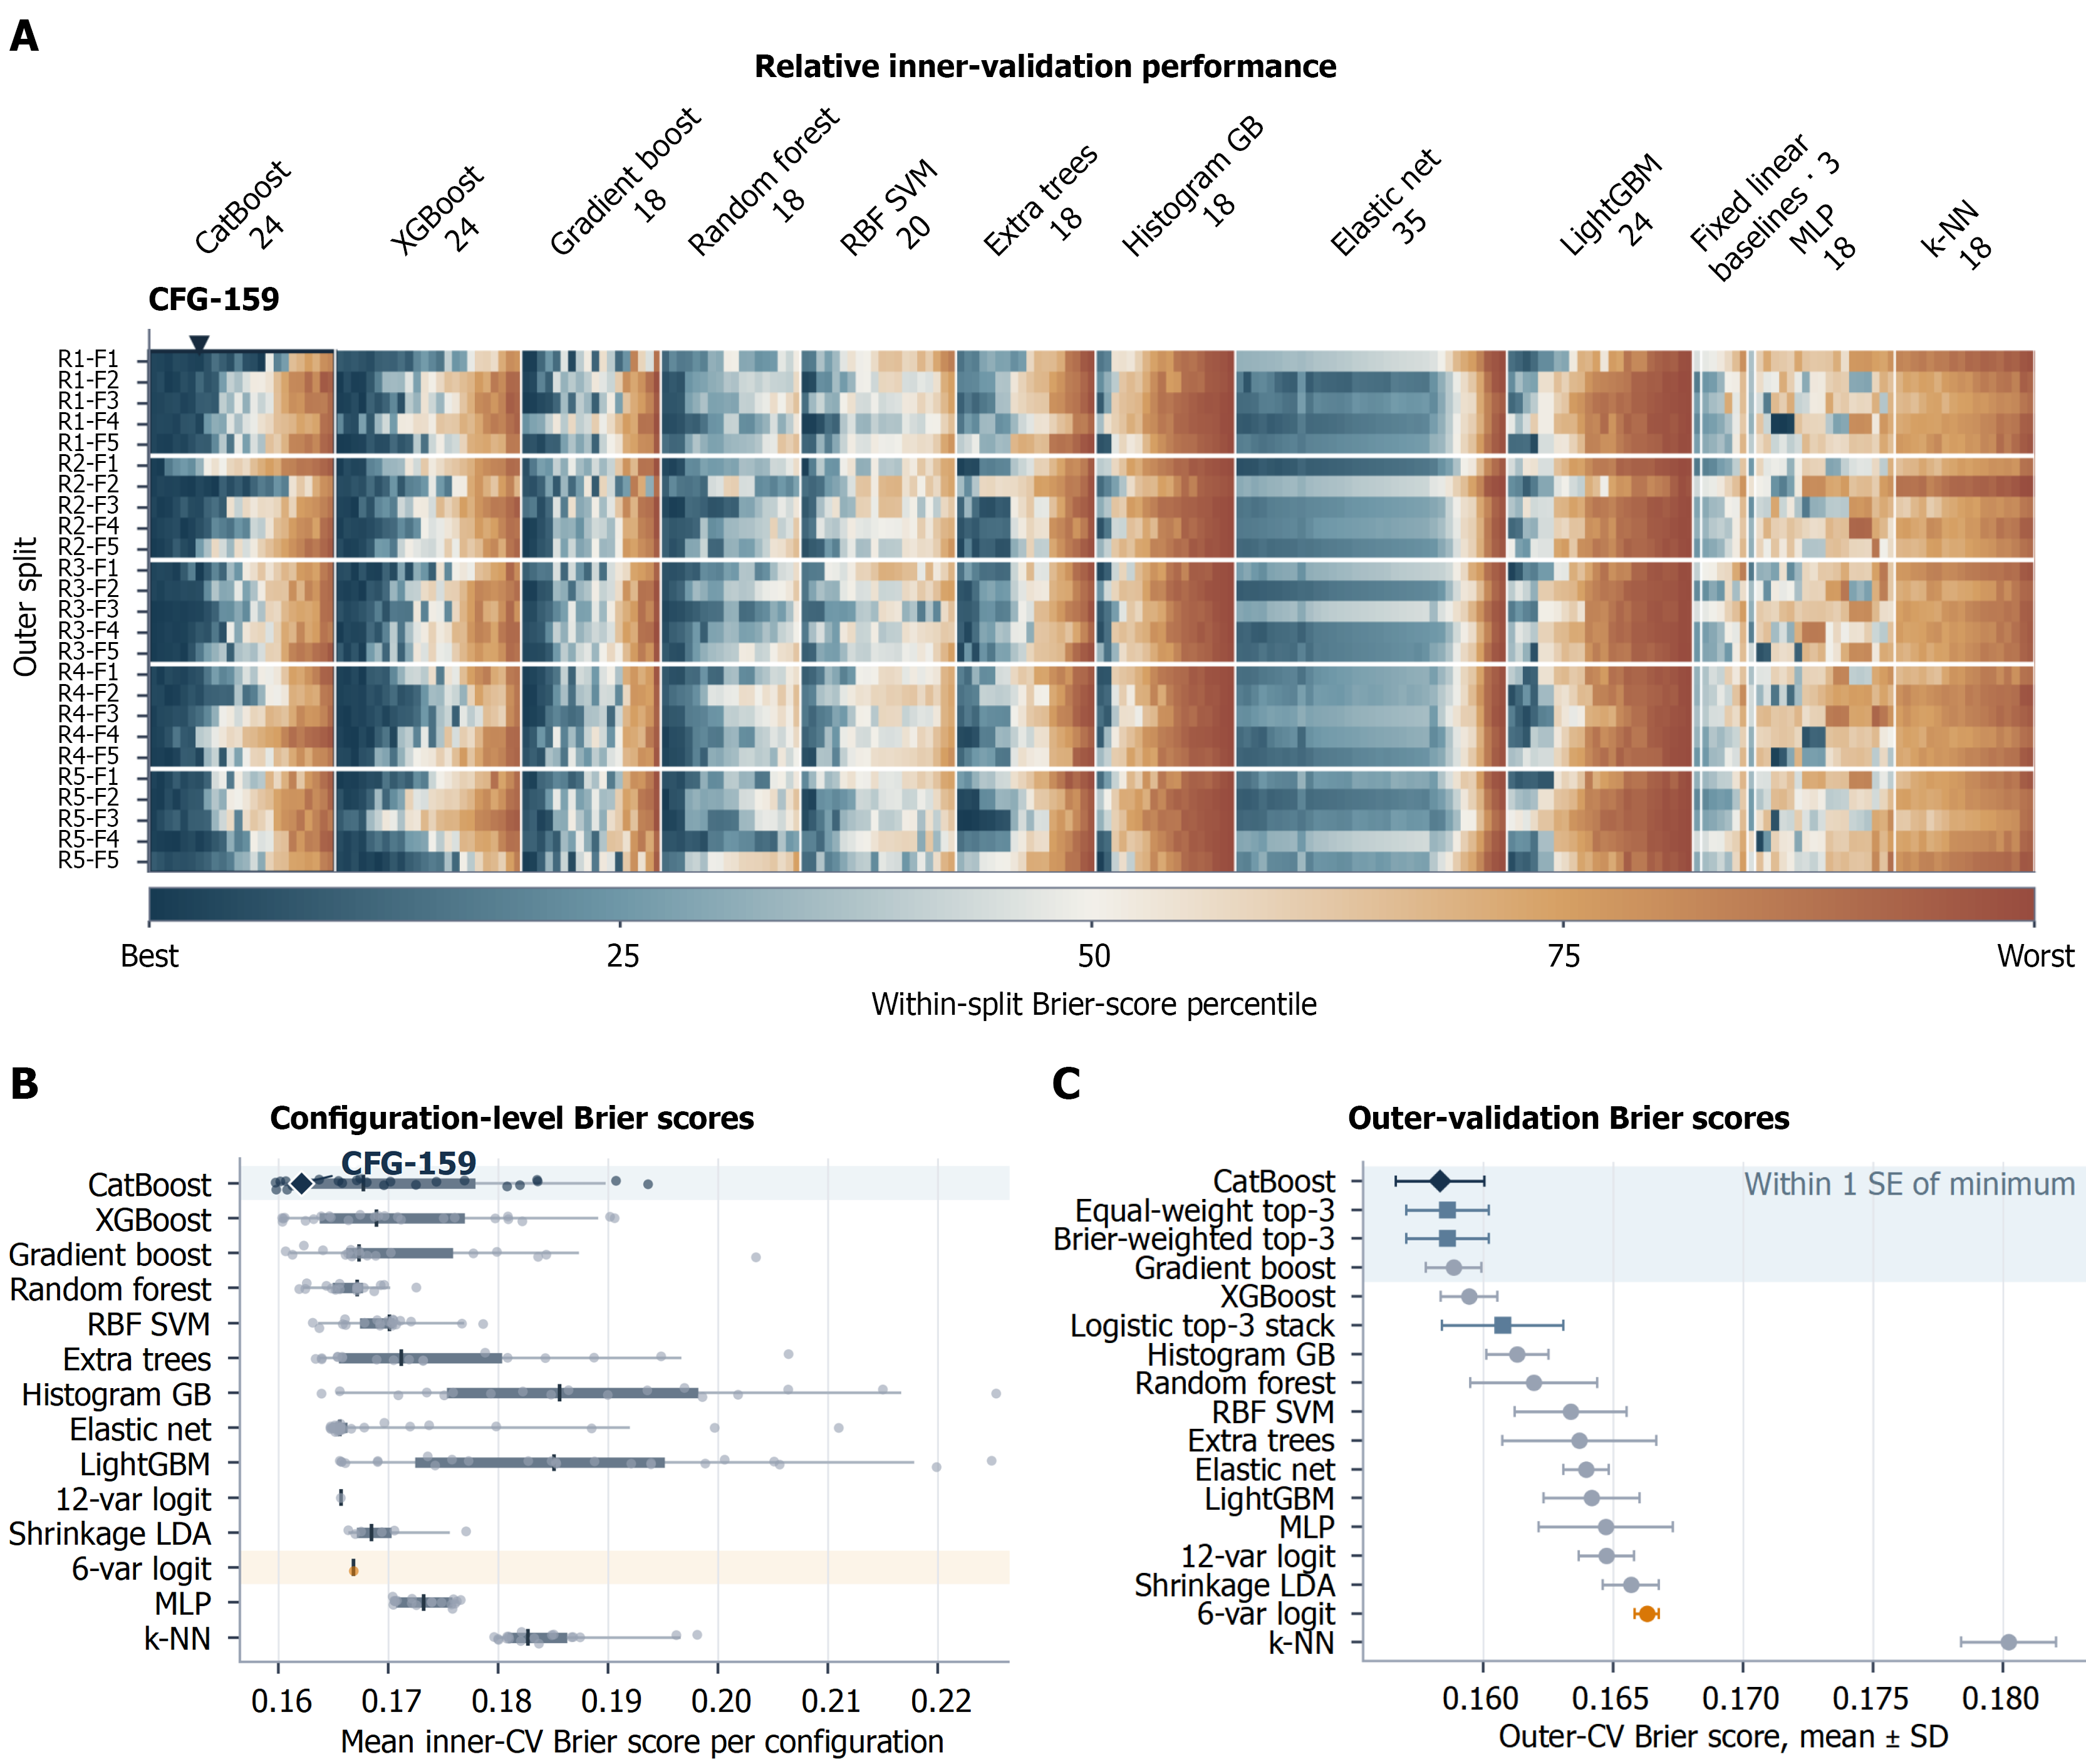
Figure 1 Internal model search and repeated nested evaluation.
A: Heatmap of all 243 prespecified hyperparameter configurations across 25 outer splits, comprising 6075 inner-validation results. Cell color represents the within-split percentile of mean inner-fold Brier score; B: Distribution of configuration-level mean inner-validation Brier scores within 14 model families; the diamond marks CFG-159; C: Mean outer-cycle Brier scores for 14 tuned base-model families and three prespecified ensembles. Error bars are SDs across five correlated repeated cycles and are not confidence intervals. Pale shading shows the prespecified descriptive one-standard-error grouping, calculated as the minimum mean Brier score plus the selected strategy’s SD divided by the square root of five; final selection remained based on the minimum mean Brier score.
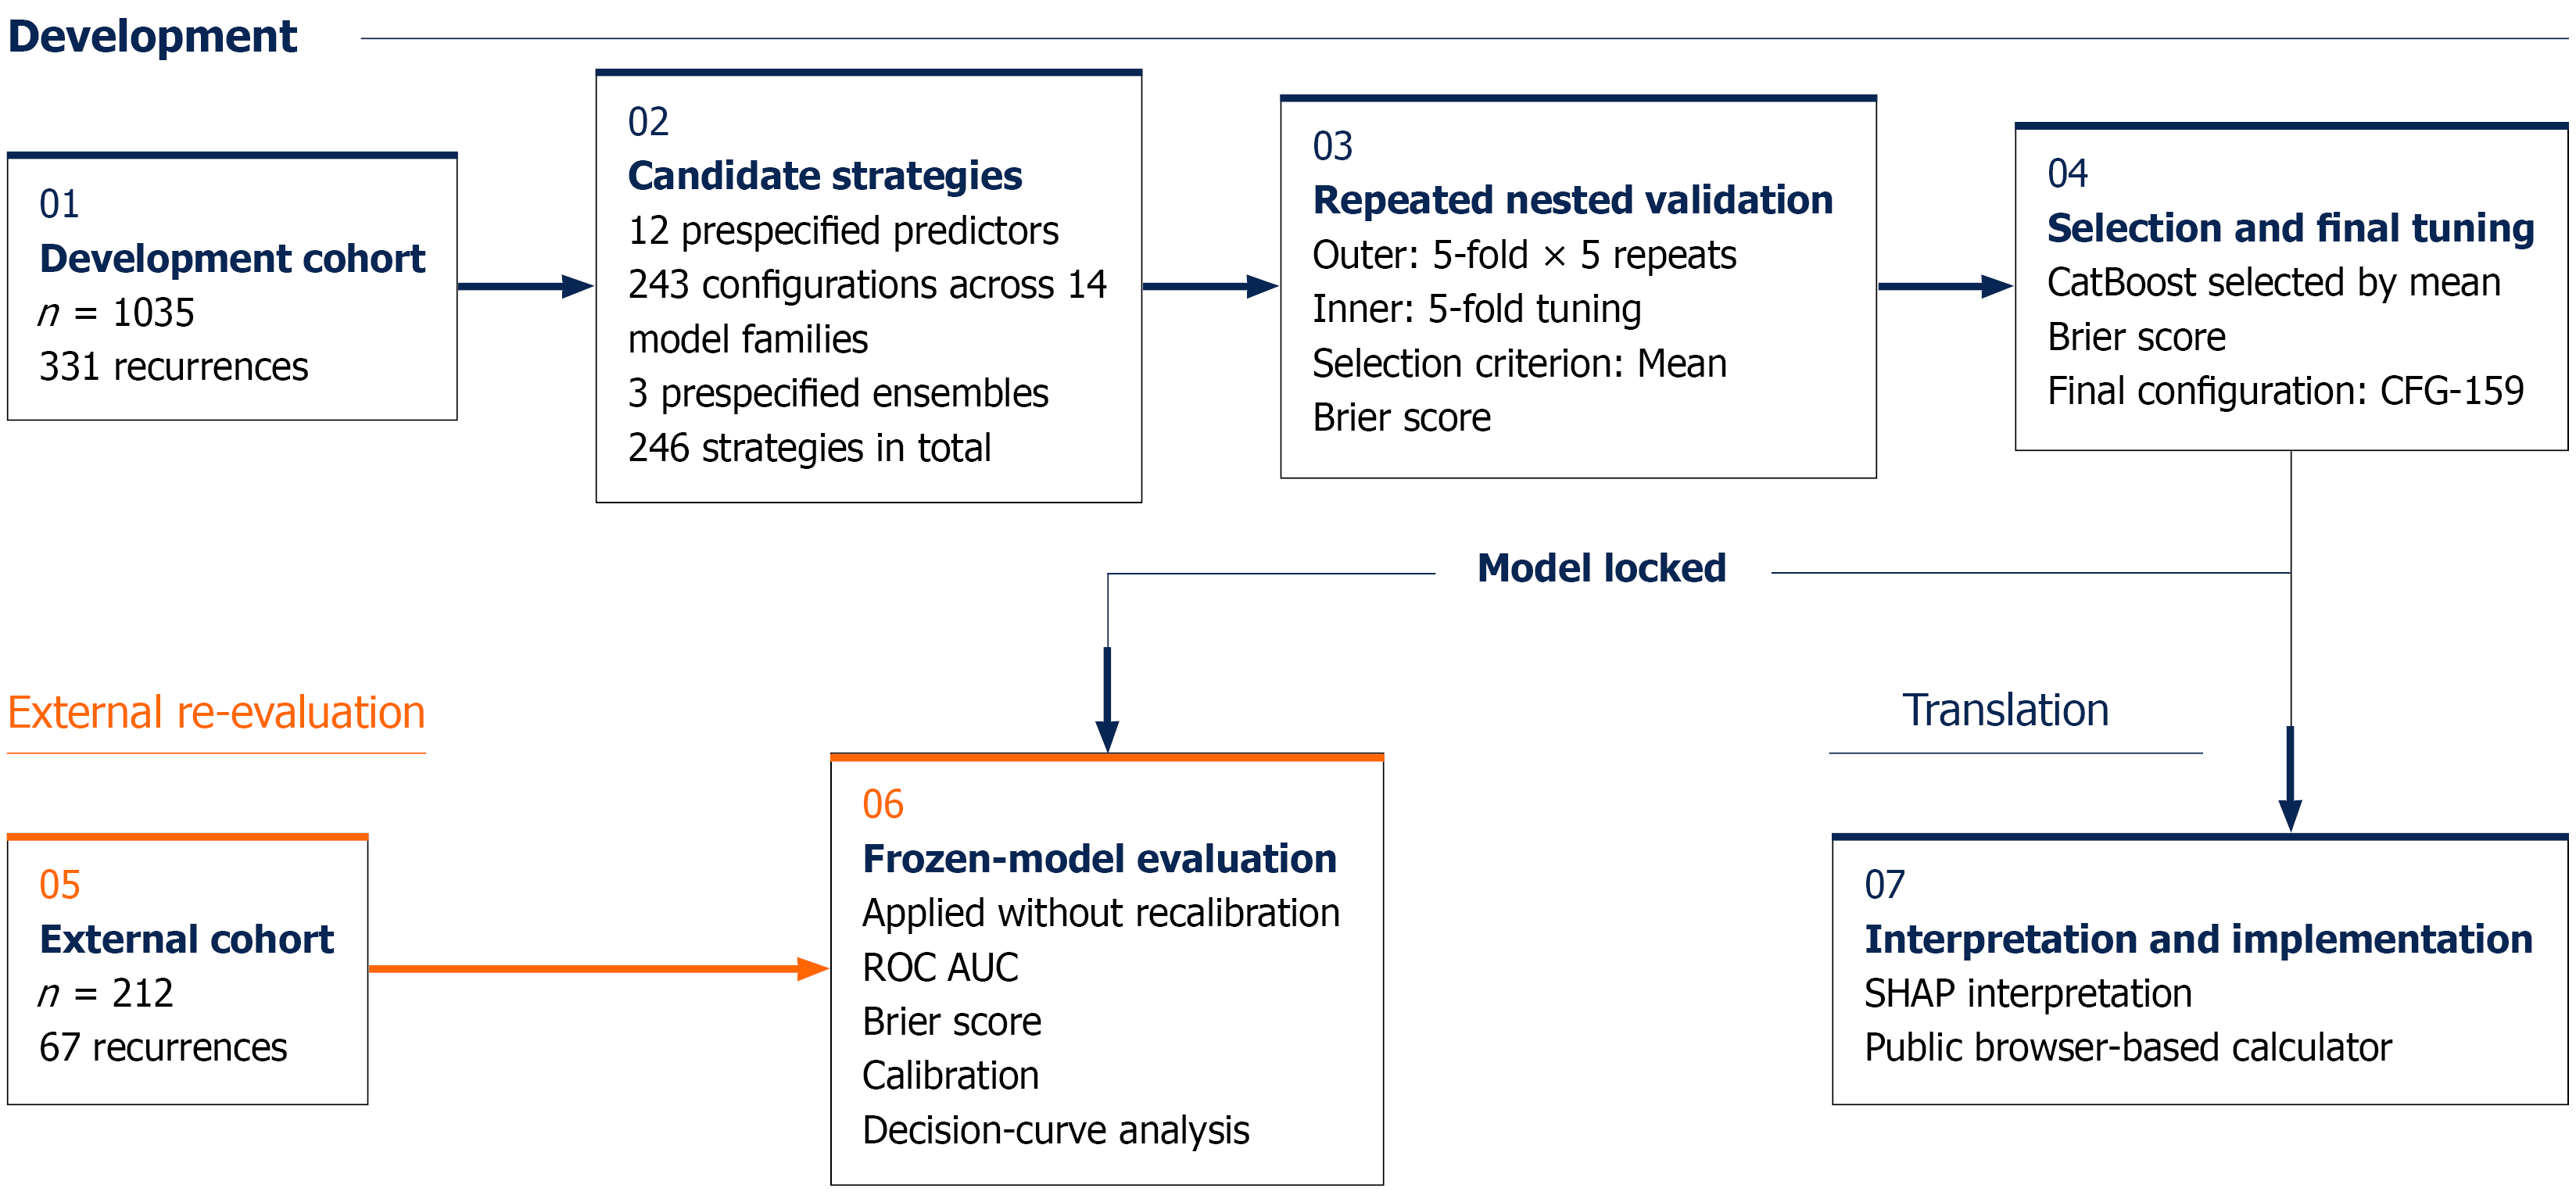
Figure 2 Protocol-frozen model-development and second-institution evaluation workflow.
The complete development cohort was evaluated by repeated nested cross-validation. CatBoost was selected by the minimum mean Brier score, tuned in the complete development cohort, frozen, and applied unchanged to the second-institution cohort. This figure depicts the analytical workflow rather than participant screening. ROC: Receiver operating characteristic; AUC: Area under the receiver operating characteristic curve; SHAP: Shapley additive explanations.
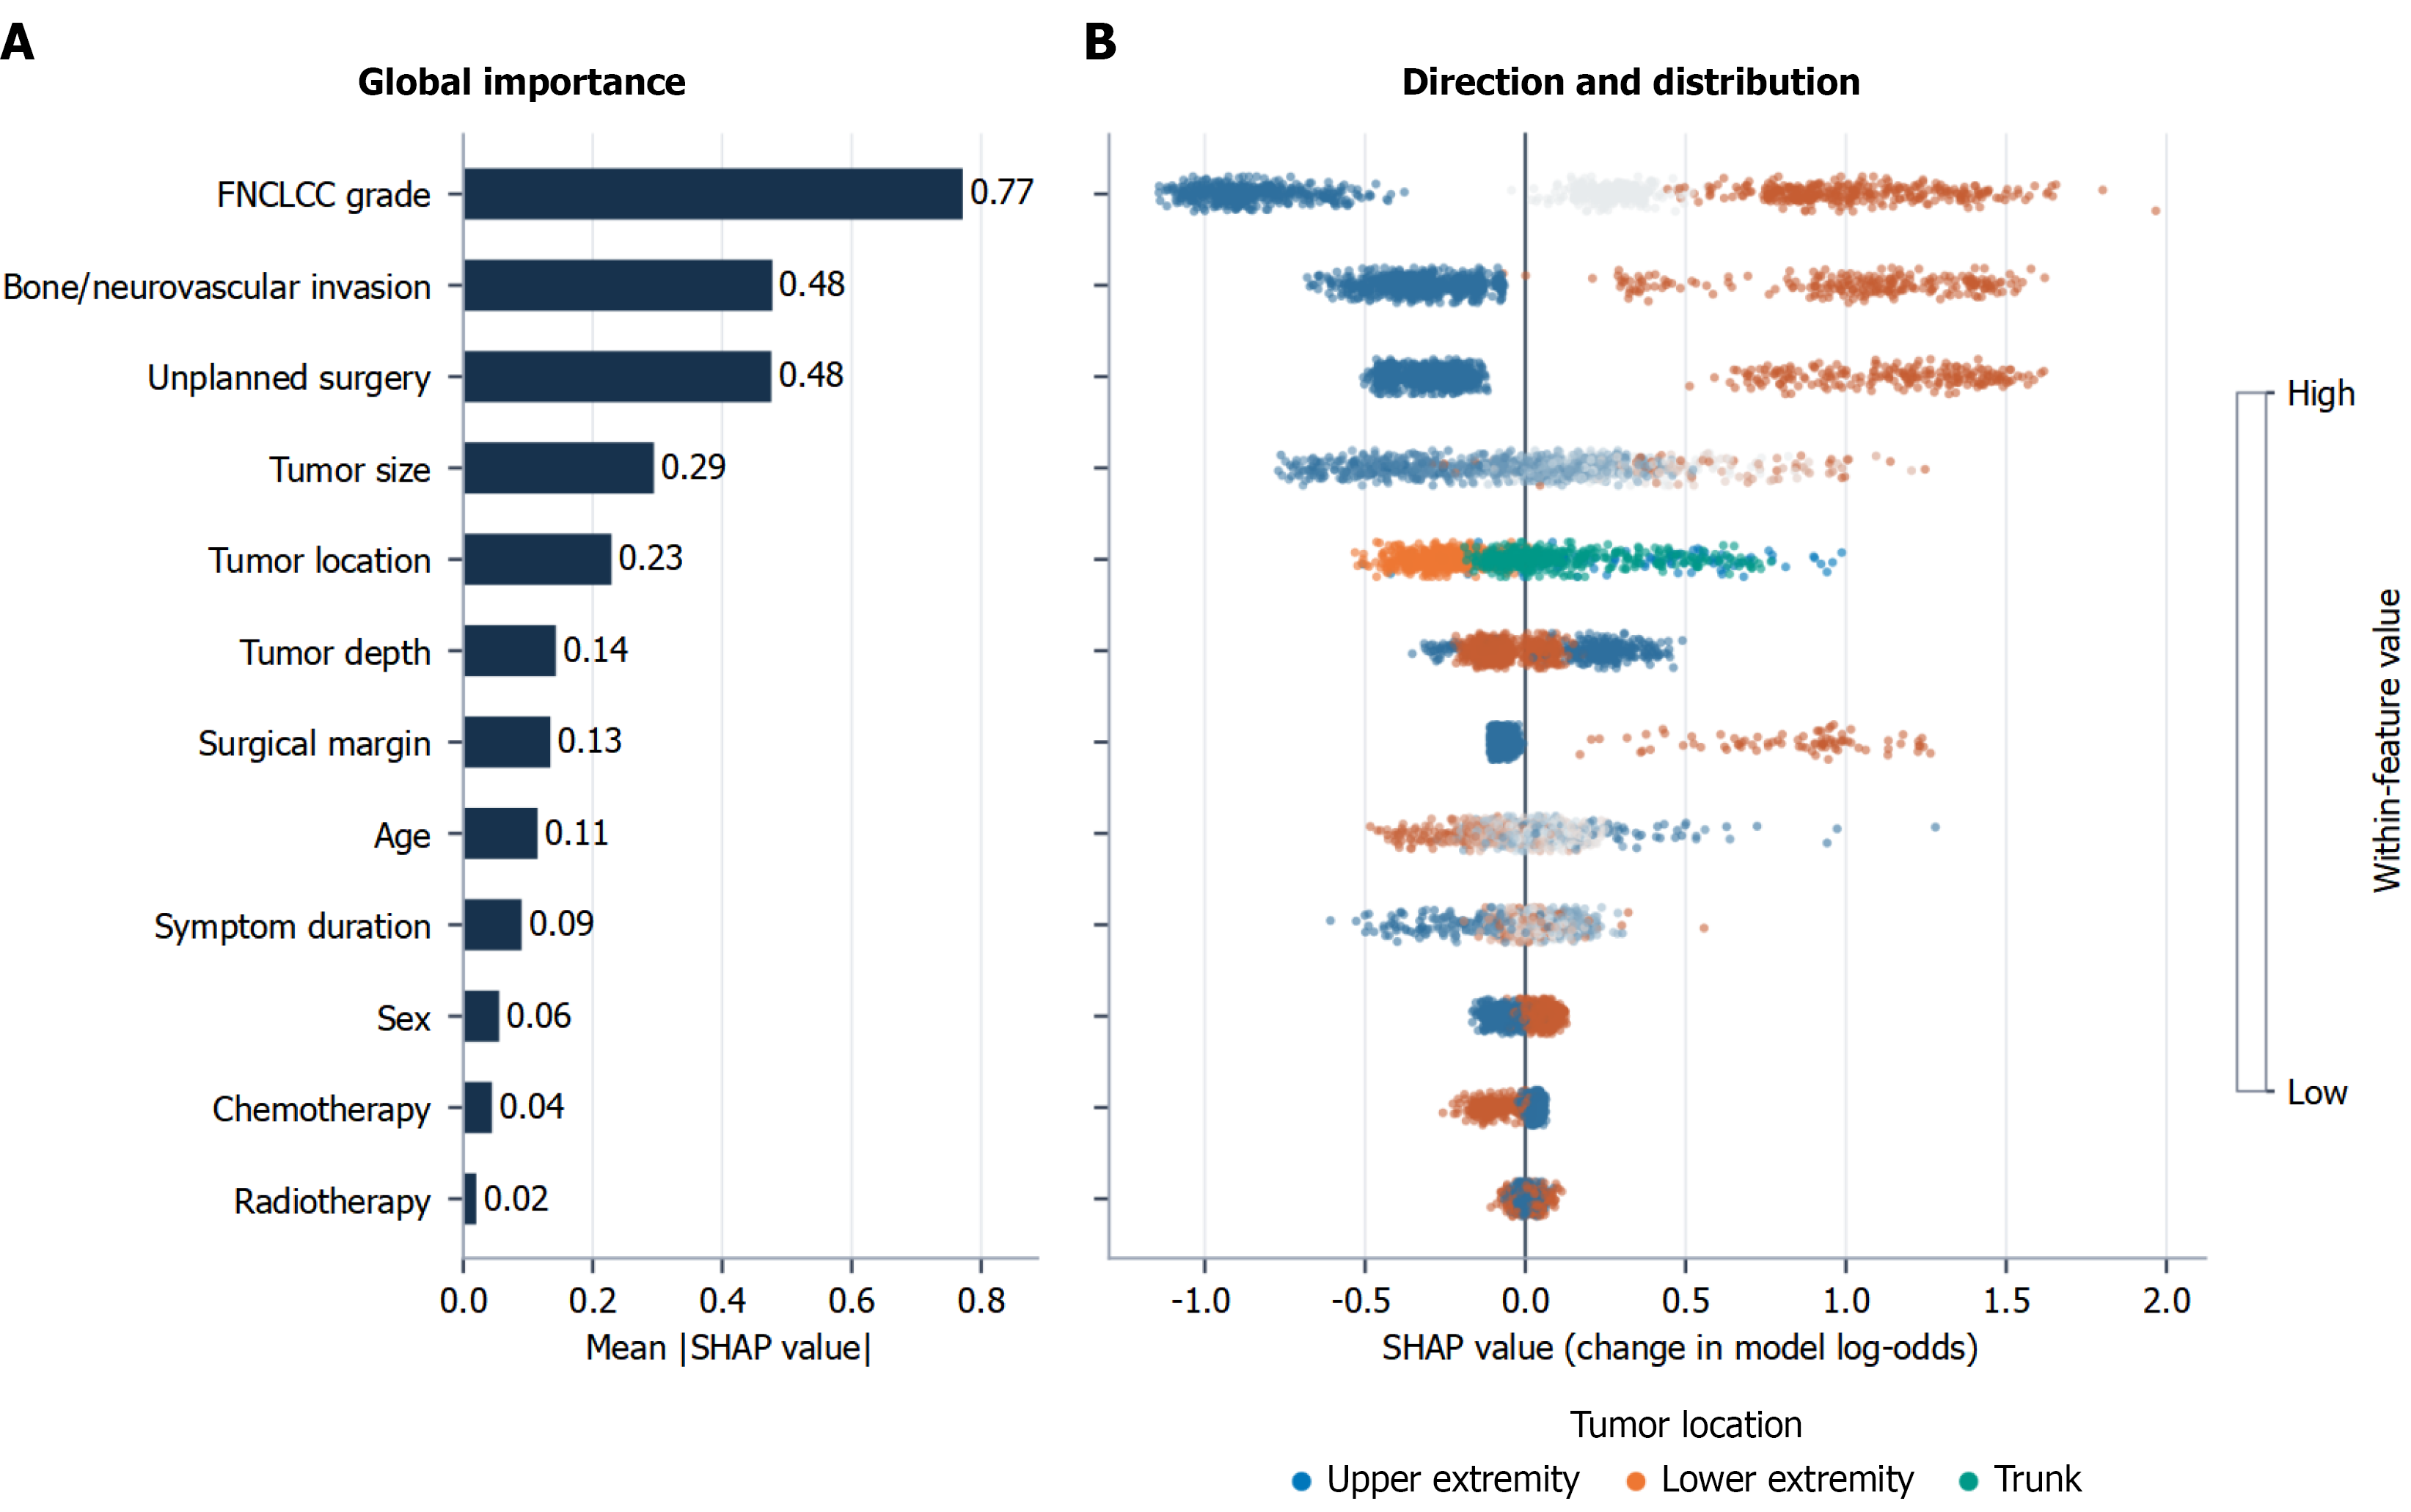
Figure 3 Global Shapley additive explanations summary for the locked CatBoost model in the development cohort.
A: Mean absolute Shapley additive explanations (SHAP) values rank average attribution magnitude; B: Each point represents one patient and shows the direction of a predictor’s contribution to model log-odds. For continuous and ordered predictors, blue indicates lower values and orange indicates higher values. Binary predictors are coded from absence/Lower category to presence/higher category. Tumor-location colors denote upper extremity, lower extremity, and trunk. SHAP attribution is descriptive of the fitted model and is not causal. FNCLCC: French Federation of Cancer Centers Sarcoma Group; SHAP: Shapley additive explanations.
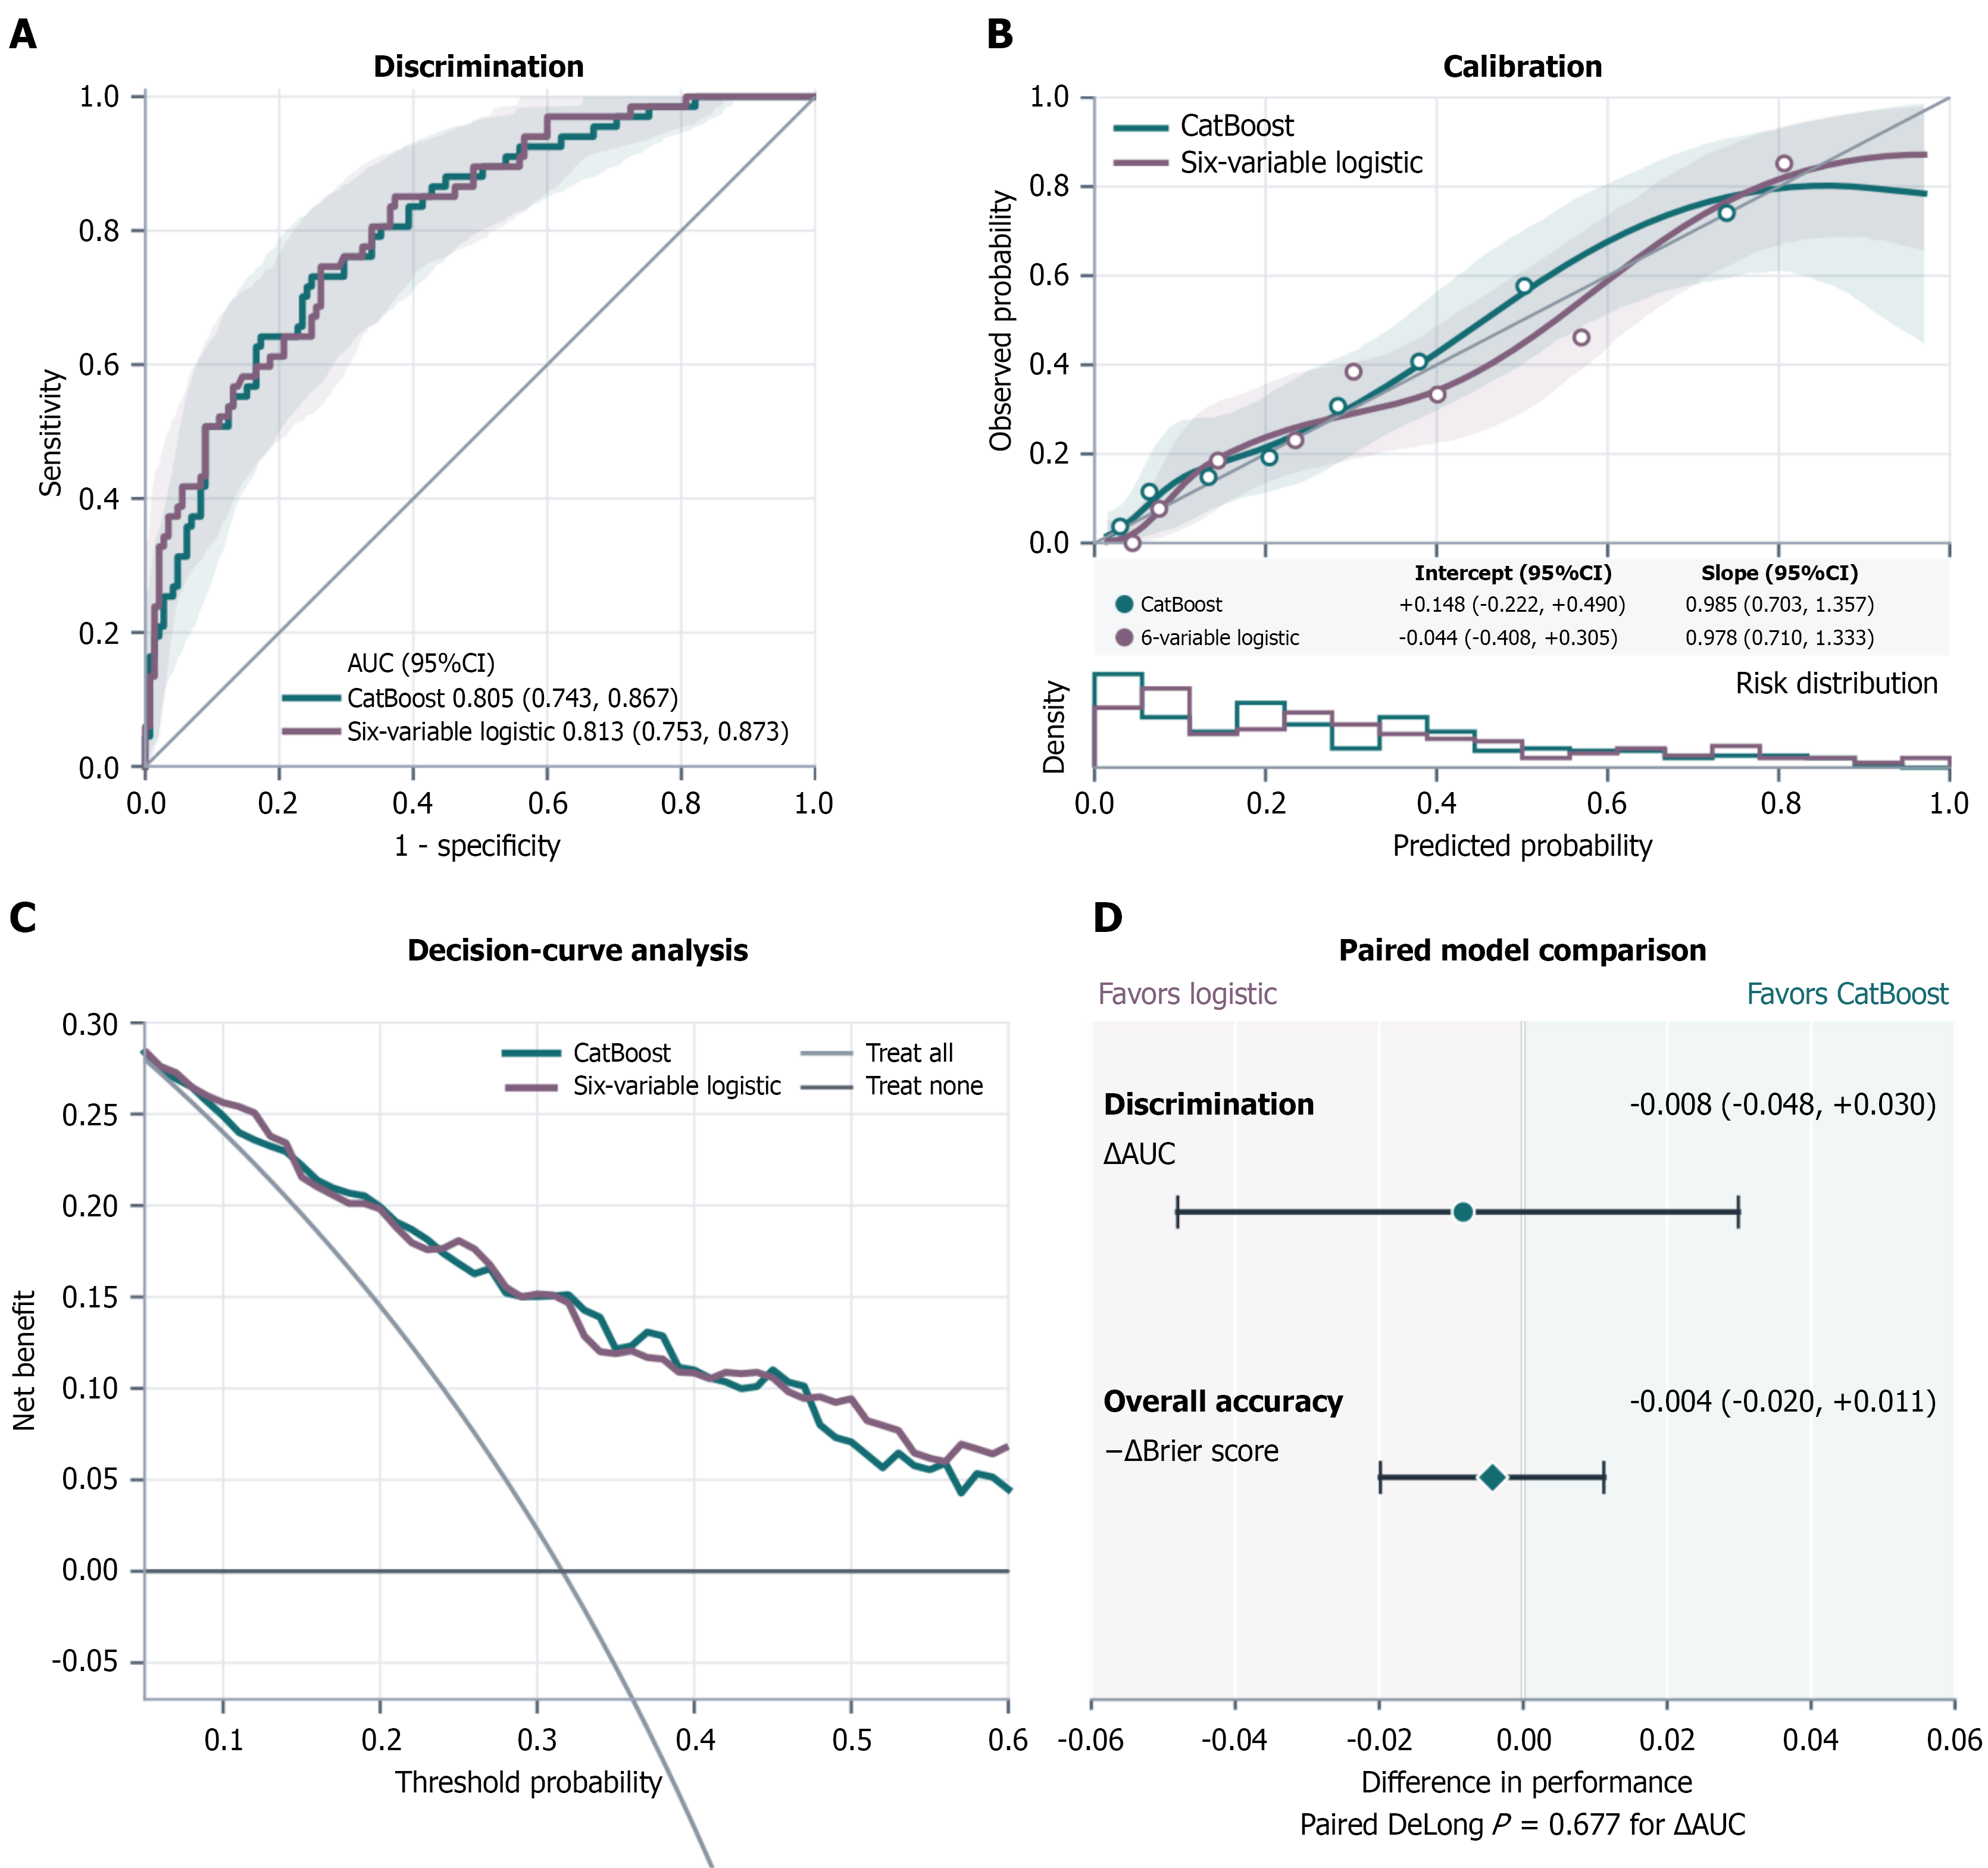
Figure 4 Protocol-frozen second-institution evaluation of CatBoost and the six-variable logistic benchmark in 212 patients.
A: Receiver operating characteristic curves; shaded regions are pointwise 95% patient-bootstrap bands, whereas the reported area under the receiver operating characteristic curve (AUC) intervals use DeLong’s method; B: Cubic-spline calibration curves using four quantile-positioned knots and degree 3, with pointwise 95% bootstrap bands, eight quantile-grouped observed proportions, and predicted-risk distributions; C: Exploratory decision curves from threshold 0.05 to 0.60; D: Paired AUC difference is CatBoost minus logistic; Brier advantage is logistic minus CatBoost. Positive values therefore favor CatBoost in both rows. All curves arose from fixed predictions without recalibration or retraining. AUC: Area under the receiver operating characteristic curve; CI: Confidence interval.
- Citation: Li ZF, Yang BC, Liu YB, Liu SQ, Zhang Q, Yu SJ. Machine learning and logistic regression for ascertainable three-year recurrence status after soft tissue sarcoma surgery. World J Clin Oncol 2026; 17(11): 126582
- URL: https://www.wjgnet.com/2218-4333/full/v17/i11/126582.htm
- DOI: https://dx.doi.org/10.5306/wjco.126582