
















Copyright: ©Author(s) 2026.
World J Clin Oncol. Nov 24, 2026; 17(11): 126582
Published online Nov 24, 2026. doi: 10.5306/wjco.126582
Published online Nov 24, 2026. doi: 10.5306/wjco.126582
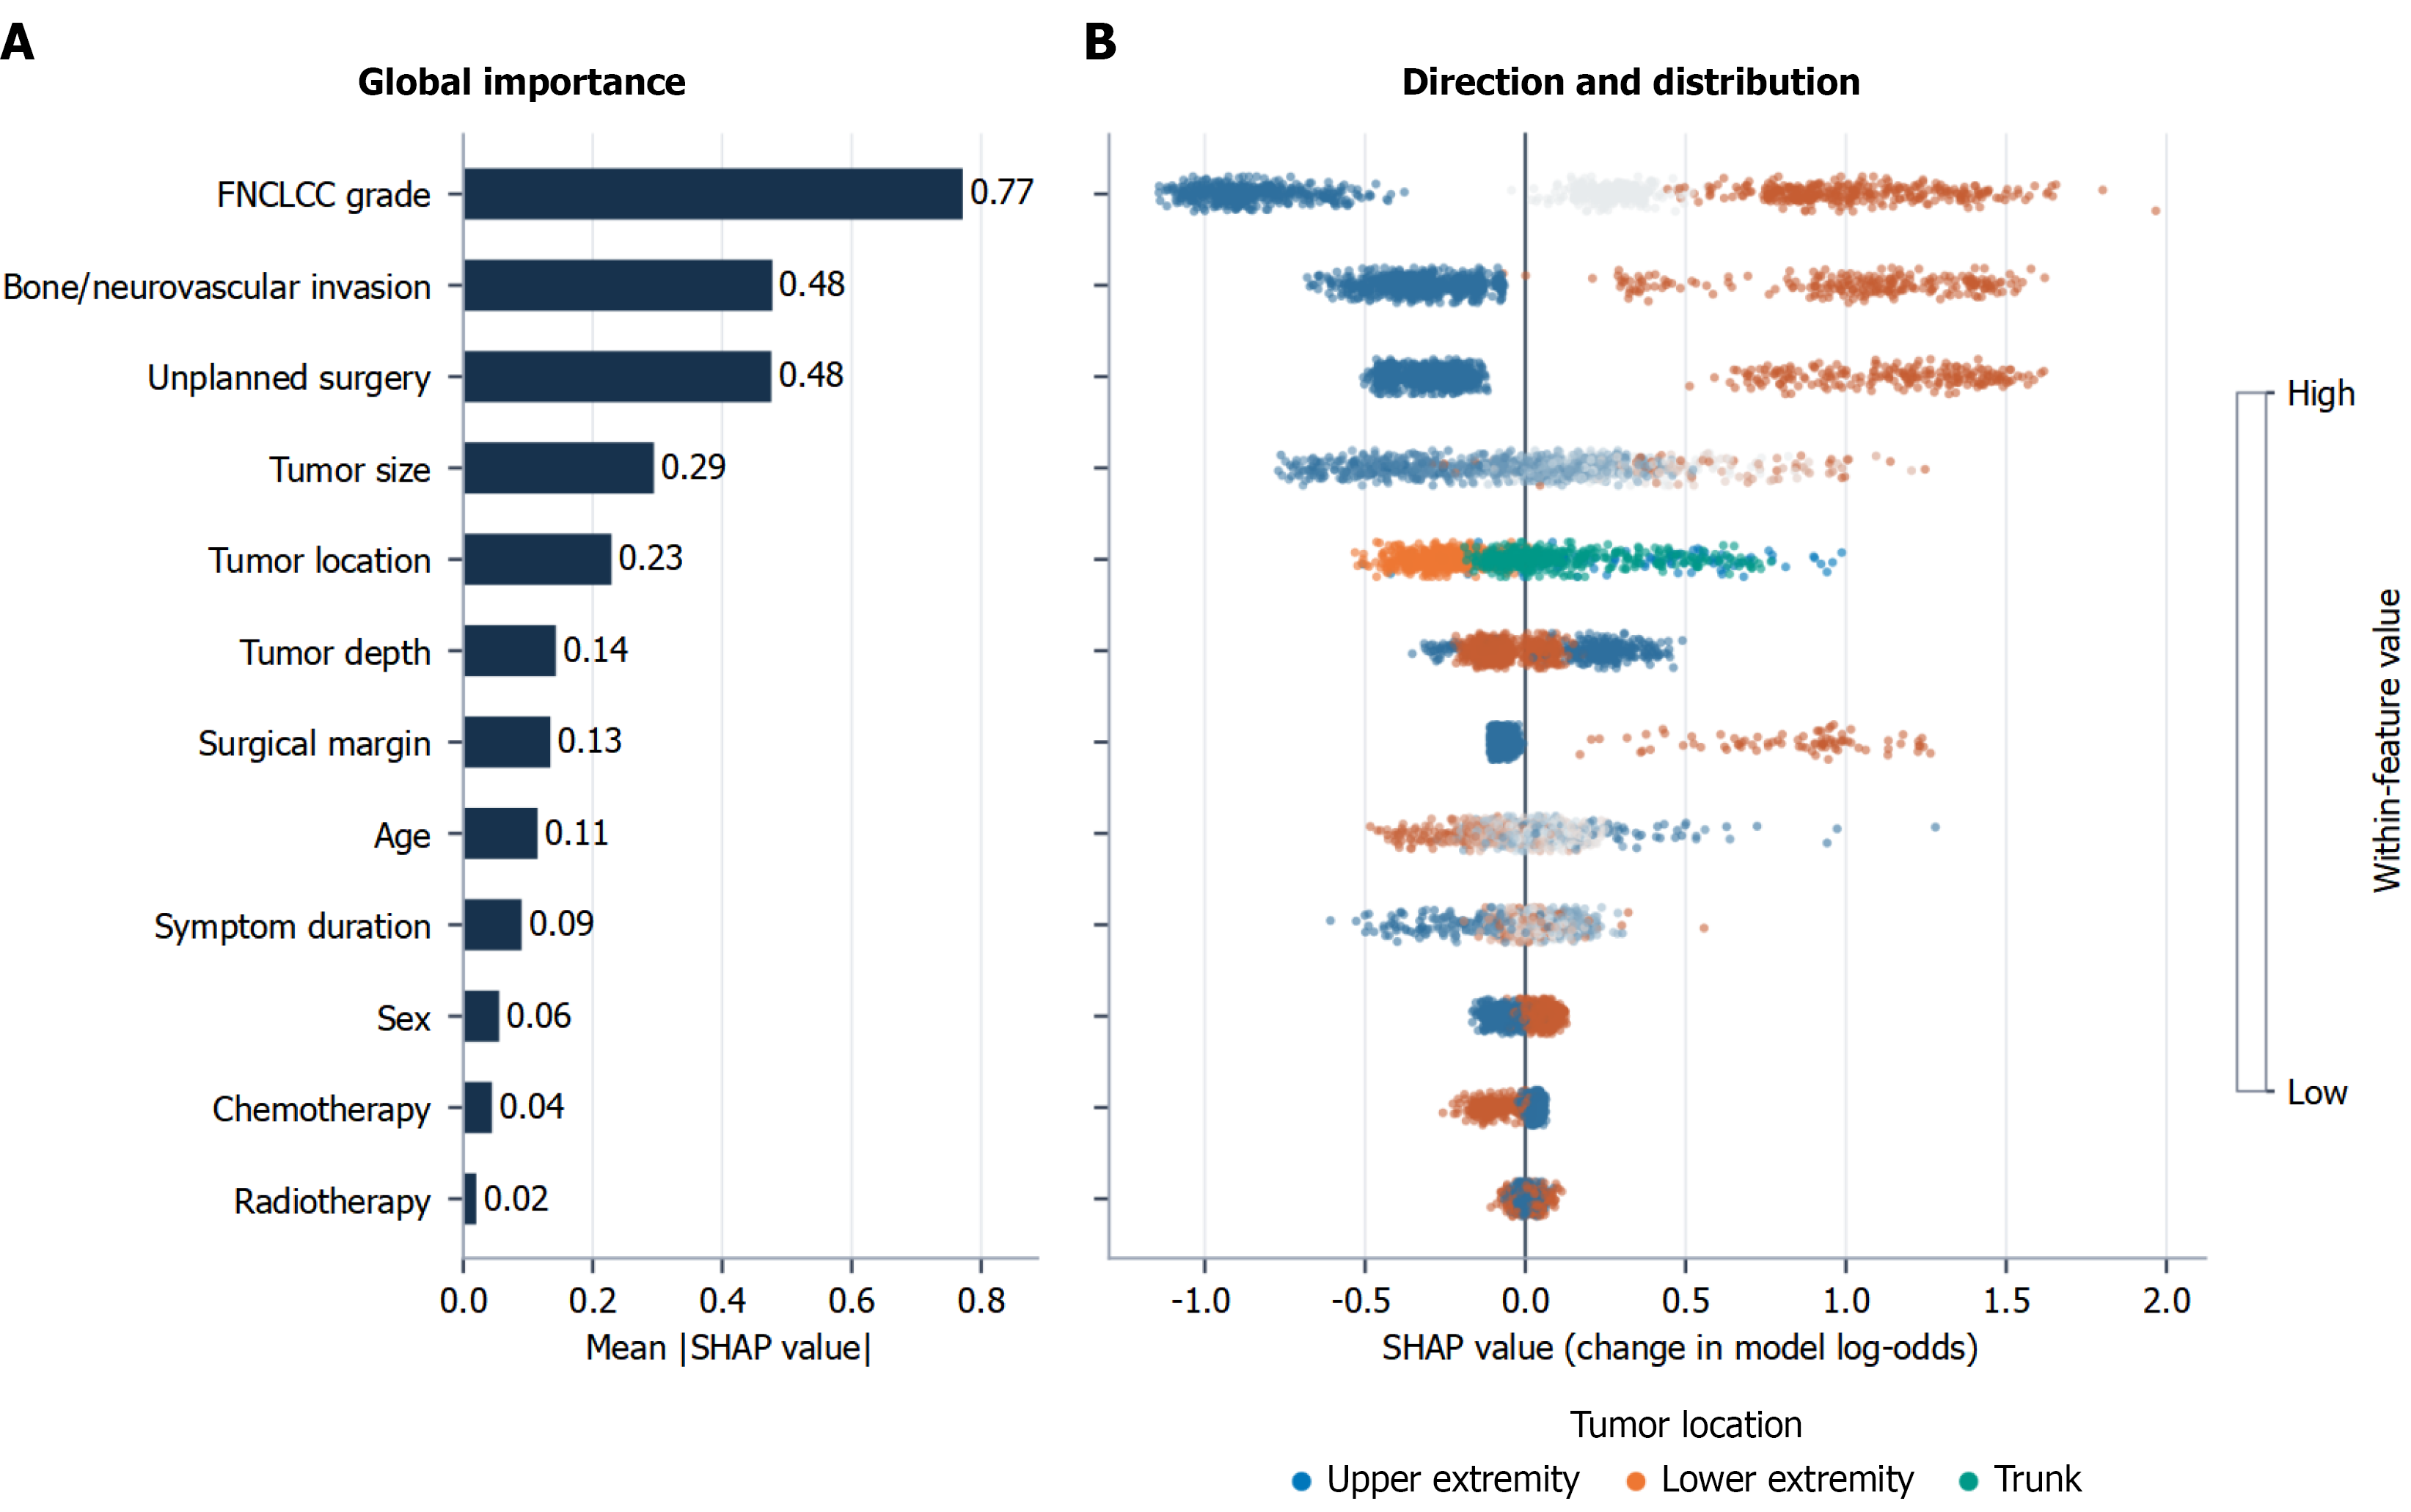
Figure 3 Global Shapley additive explanations summary for the locked CatBoost model in the development cohort.
A: Mean absolute Shapley additive explanations (SHAP) values rank average attribution magnitude; B: Each point represents one patient and shows the direction of a predictor’s contribution to model log-odds. For continuous and ordered predictors, blue indicates lower values and orange indicates higher values. Binary predictors are coded from absence/Lower category to presence/higher category. Tumor-location colors denote upper extremity, lower extremity, and trunk. SHAP attribution is descriptive of the fitted model and is not causal. FNCLCC: French Federation of Cancer Centers Sarcoma Group; SHAP: Shapley additive explanations.
- Citation: Li ZF, Yang BC, Liu YB, Liu SQ, Zhang Q, Yu SJ. Machine learning and logistic regression for ascertainable three-year recurrence status after soft tissue sarcoma surgery. World J Clin Oncol 2026; 17(11): 126582
- URL: https://www.wjgnet.com/2218-4333/full/v17/i11/126582.htm
- DOI: https://dx.doi.org/10.5306/wjco.126582