
















Copyright: ©Author(s) 2026.
World J Clin Oncol. Nov 24, 2026; 17(11): 126582
Published online Nov 24, 2026. doi: 10.5306/wjco.126582
Published online Nov 24, 2026. doi: 10.5306/wjco.126582
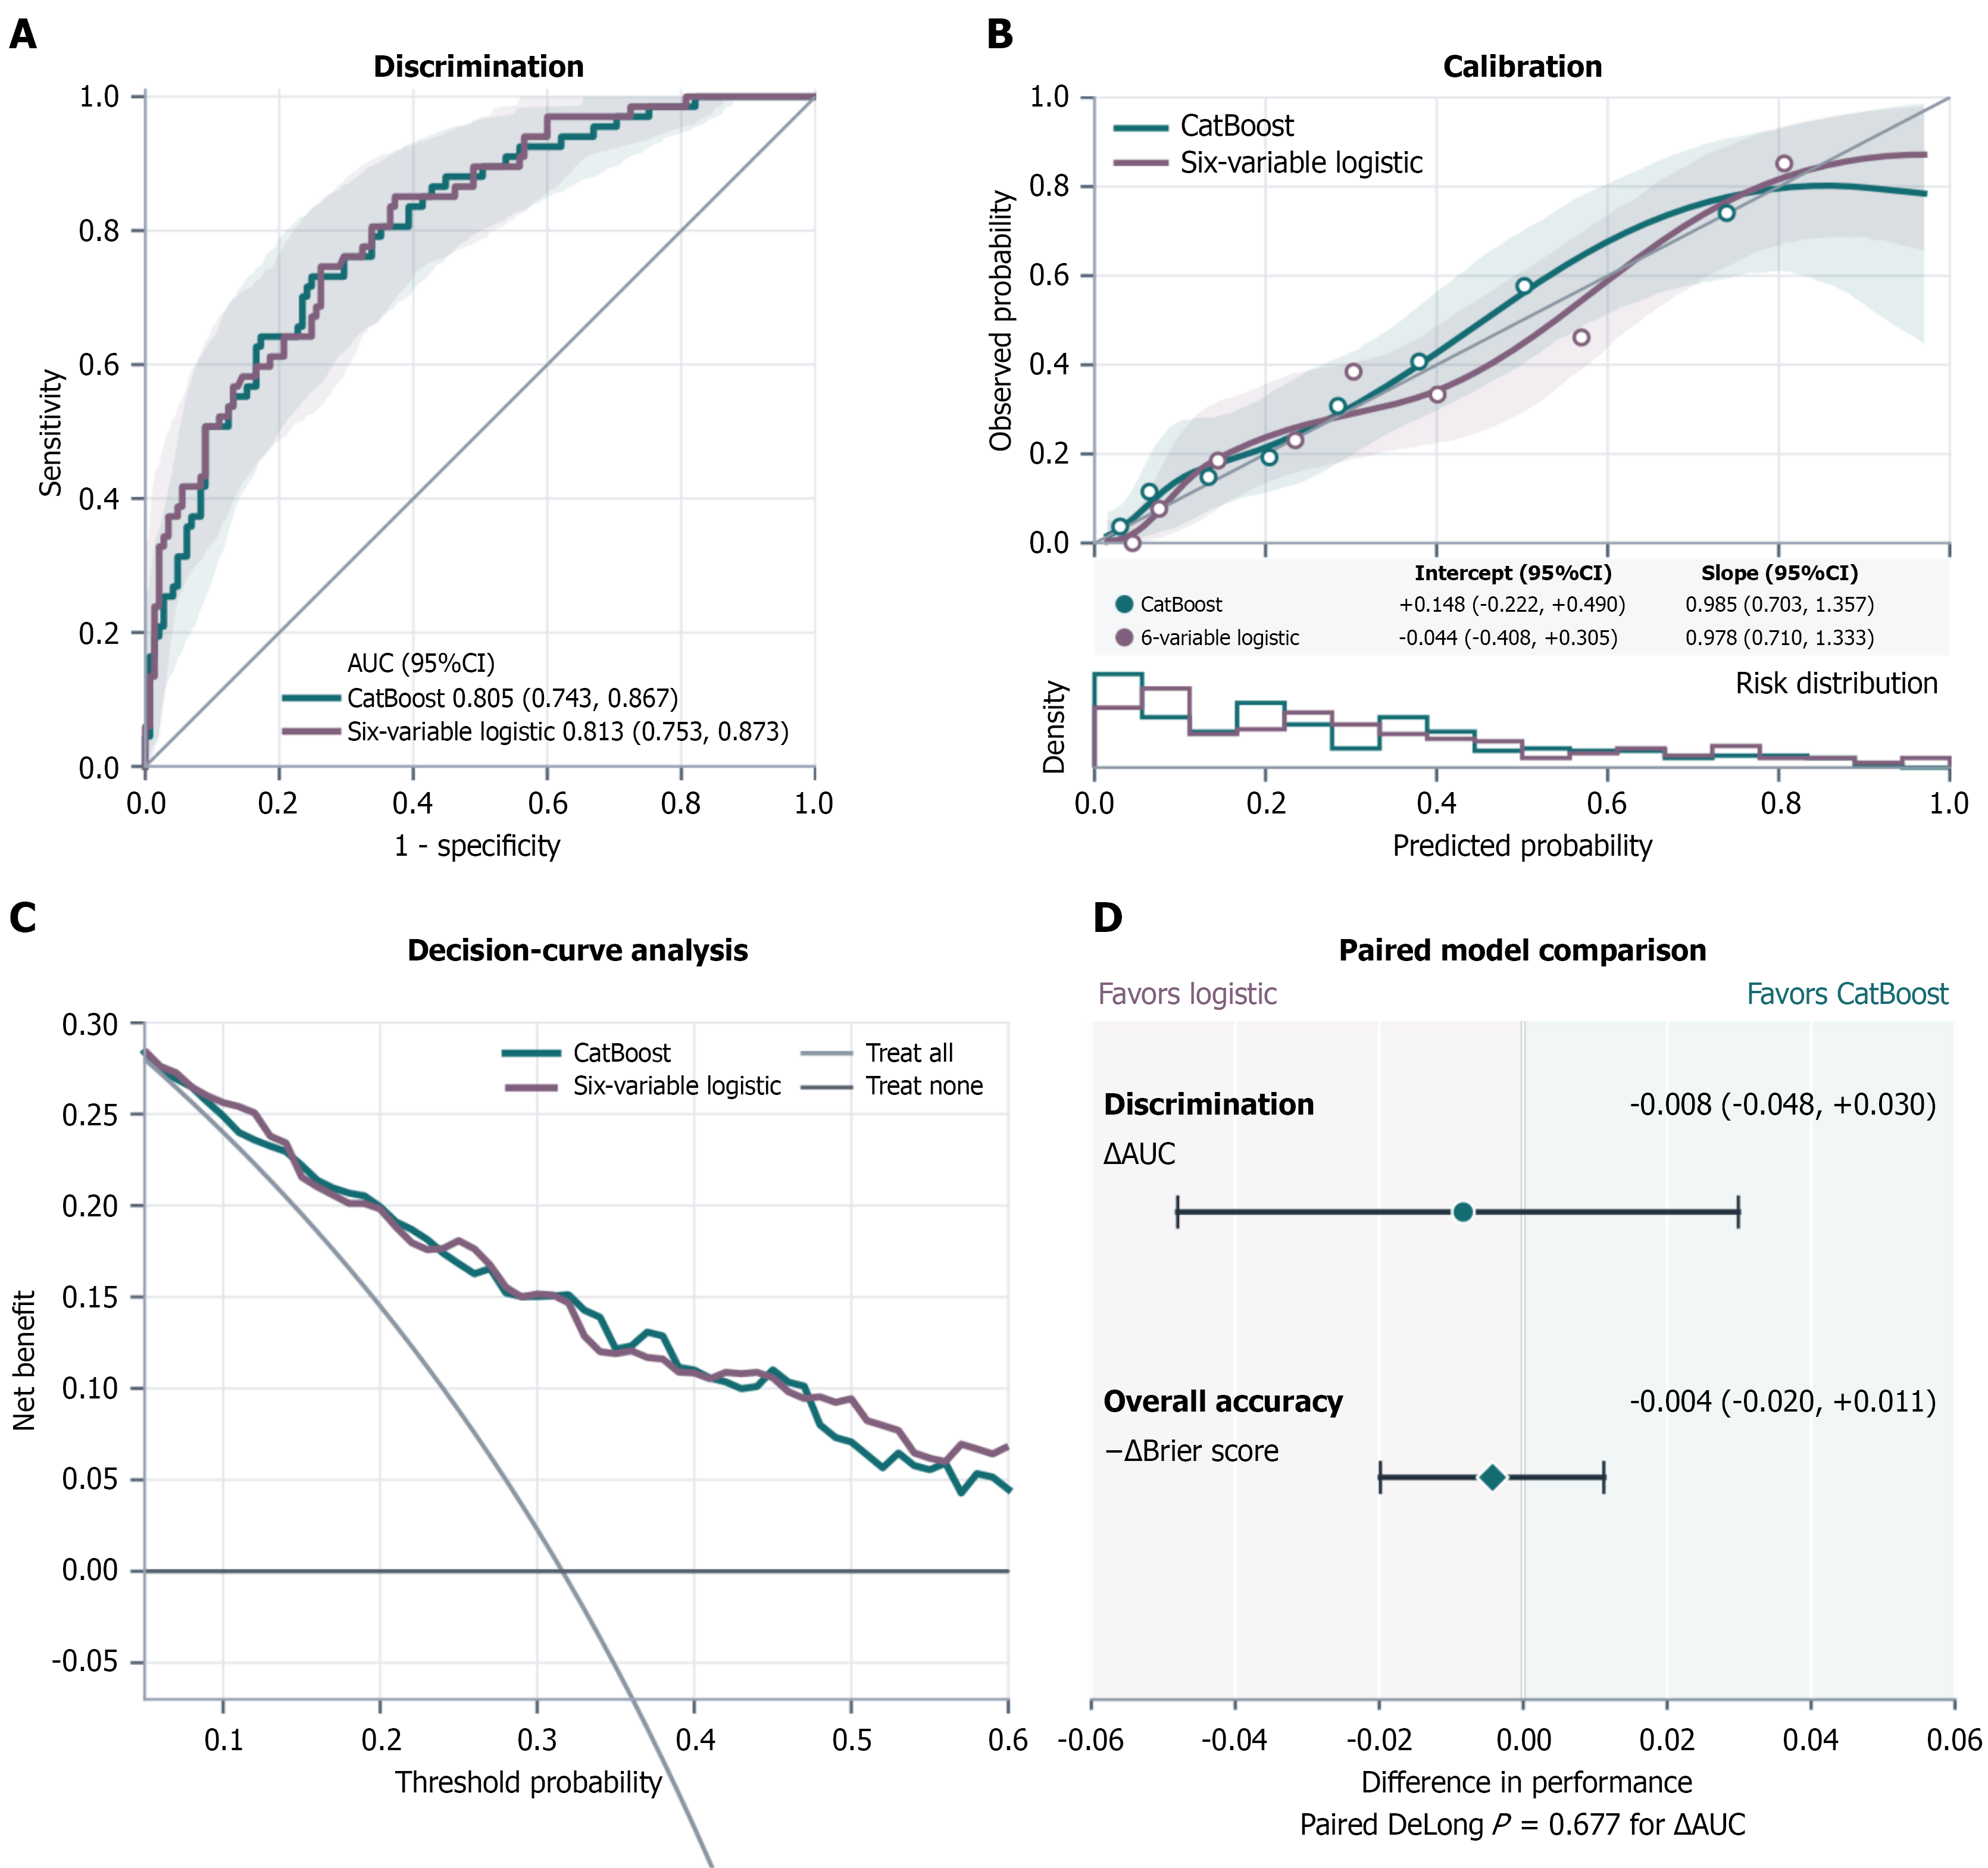
Figure 4 Protocol-frozen second-institution evaluation of CatBoost and the six-variable logistic benchmark in 212 patients.
A: Receiver operating characteristic curves; shaded regions are pointwise 95% patient-bootstrap bands, whereas the reported area under the receiver operating characteristic curve (AUC) intervals use DeLong’s method; B: Cubic-spline calibration curves using four quantile-positioned knots and degree 3, with pointwise 95% bootstrap bands, eight quantile-grouped observed proportions, and predicted-risk distributions; C: Exploratory decision curves from threshold 0.05 to 0.60; D: Paired AUC difference is CatBoost minus logistic; Brier advantage is logistic minus CatBoost. Positive values therefore favor CatBoost in both rows. All curves arose from fixed predictions without recalibration or retraining. AUC: Area under the receiver operating characteristic curve; CI: Confidence interval.
- Citation: Li ZF, Yang BC, Liu YB, Liu SQ, Zhang Q, Yu SJ. Machine learning and logistic regression for ascertainable three-year recurrence status after soft tissue sarcoma surgery. World J Clin Oncol 2026; 17(11): 126582
- URL: https://www.wjgnet.com/2218-4333/full/v17/i11/126582.htm
- DOI: https://dx.doi.org/10.5306/wjco.126582