Copyright
©The Author(s) 2025.
World J Clin Oncol. Jun 24, 2025; 16(6): 105691
Published online Jun 24, 2025. doi: 10.5306/wjco.v16.i6.105691
Published online Jun 24, 2025. doi: 10.5306/wjco.v16.i6.105691
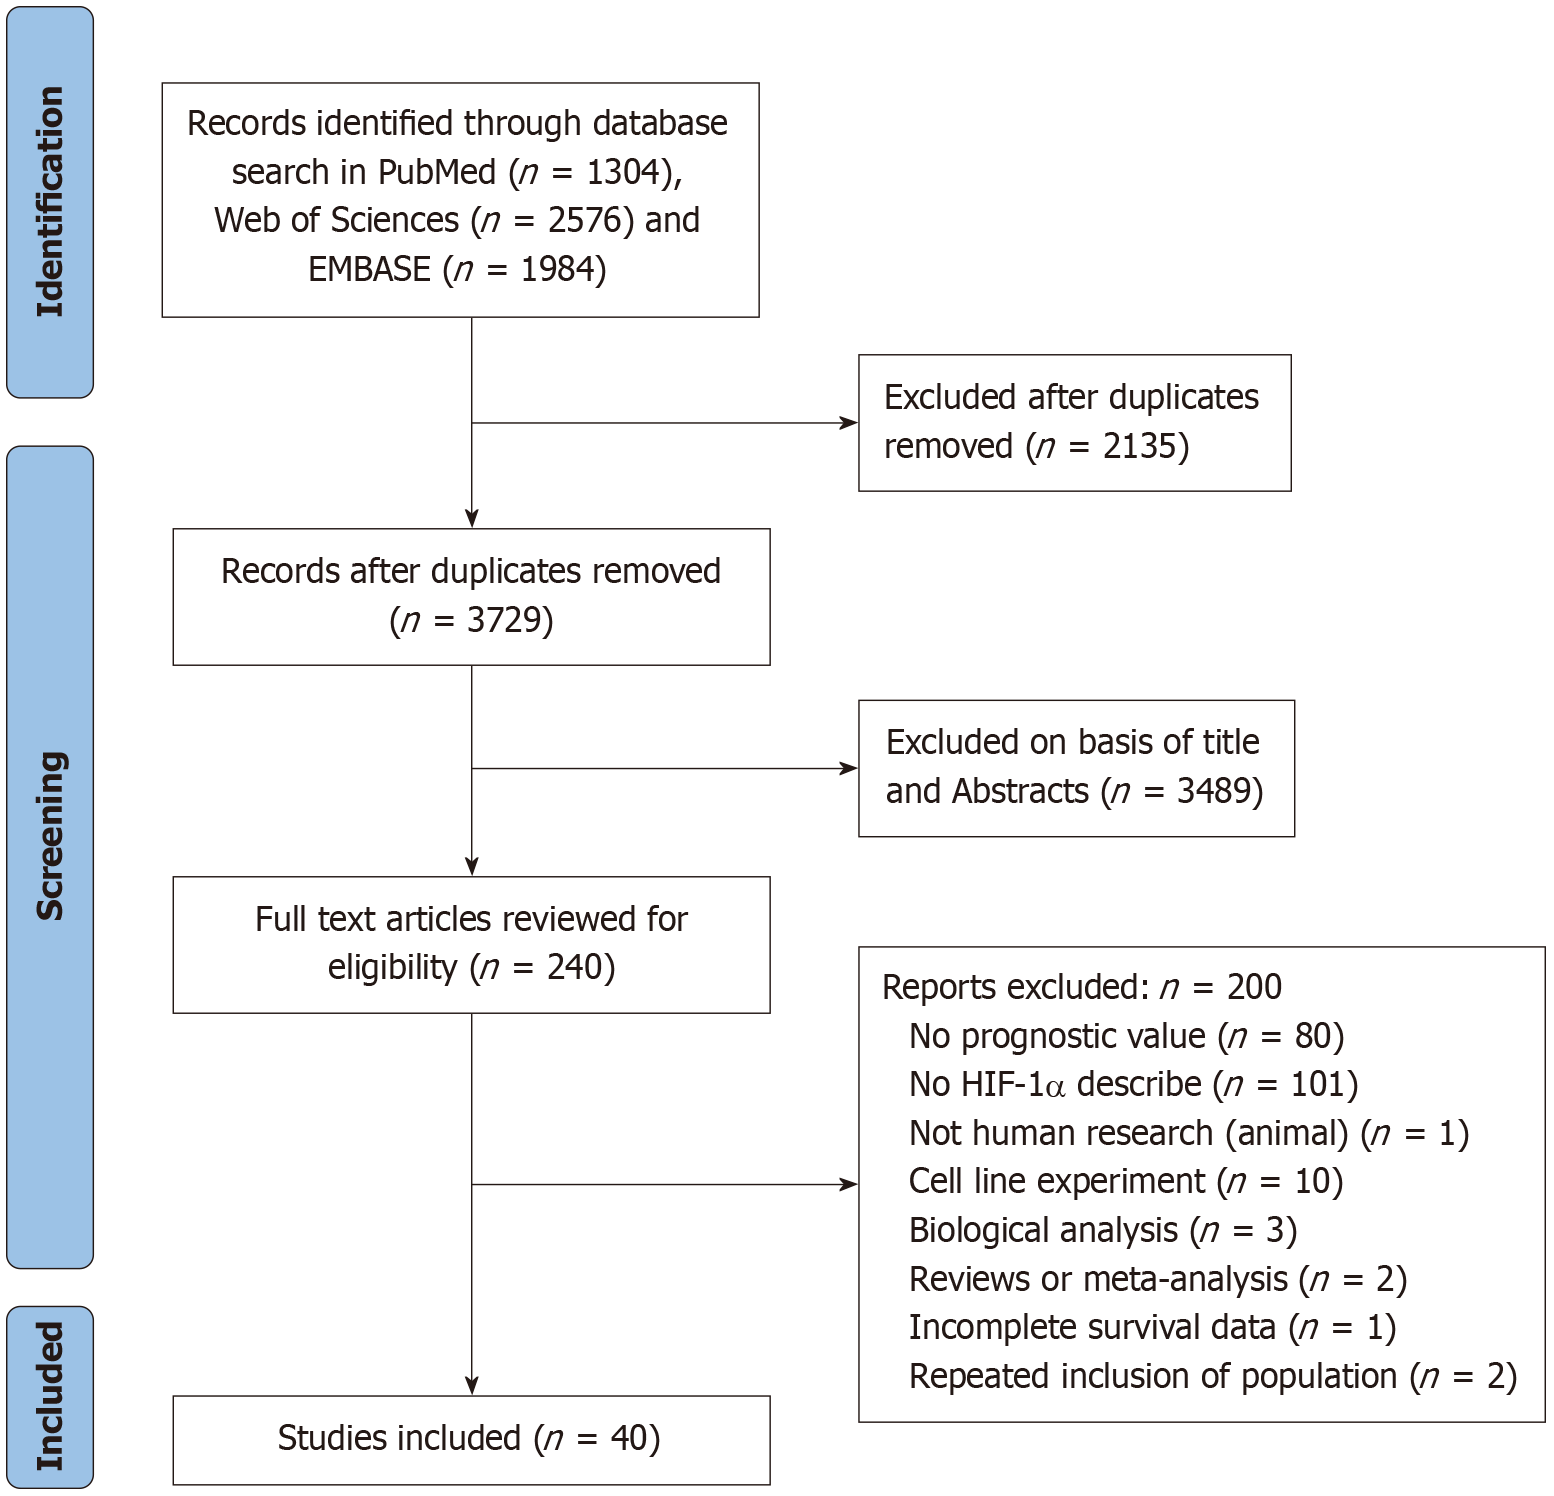
Figure 1 Flow chart of literature screening for systematic review and meta-analysis.
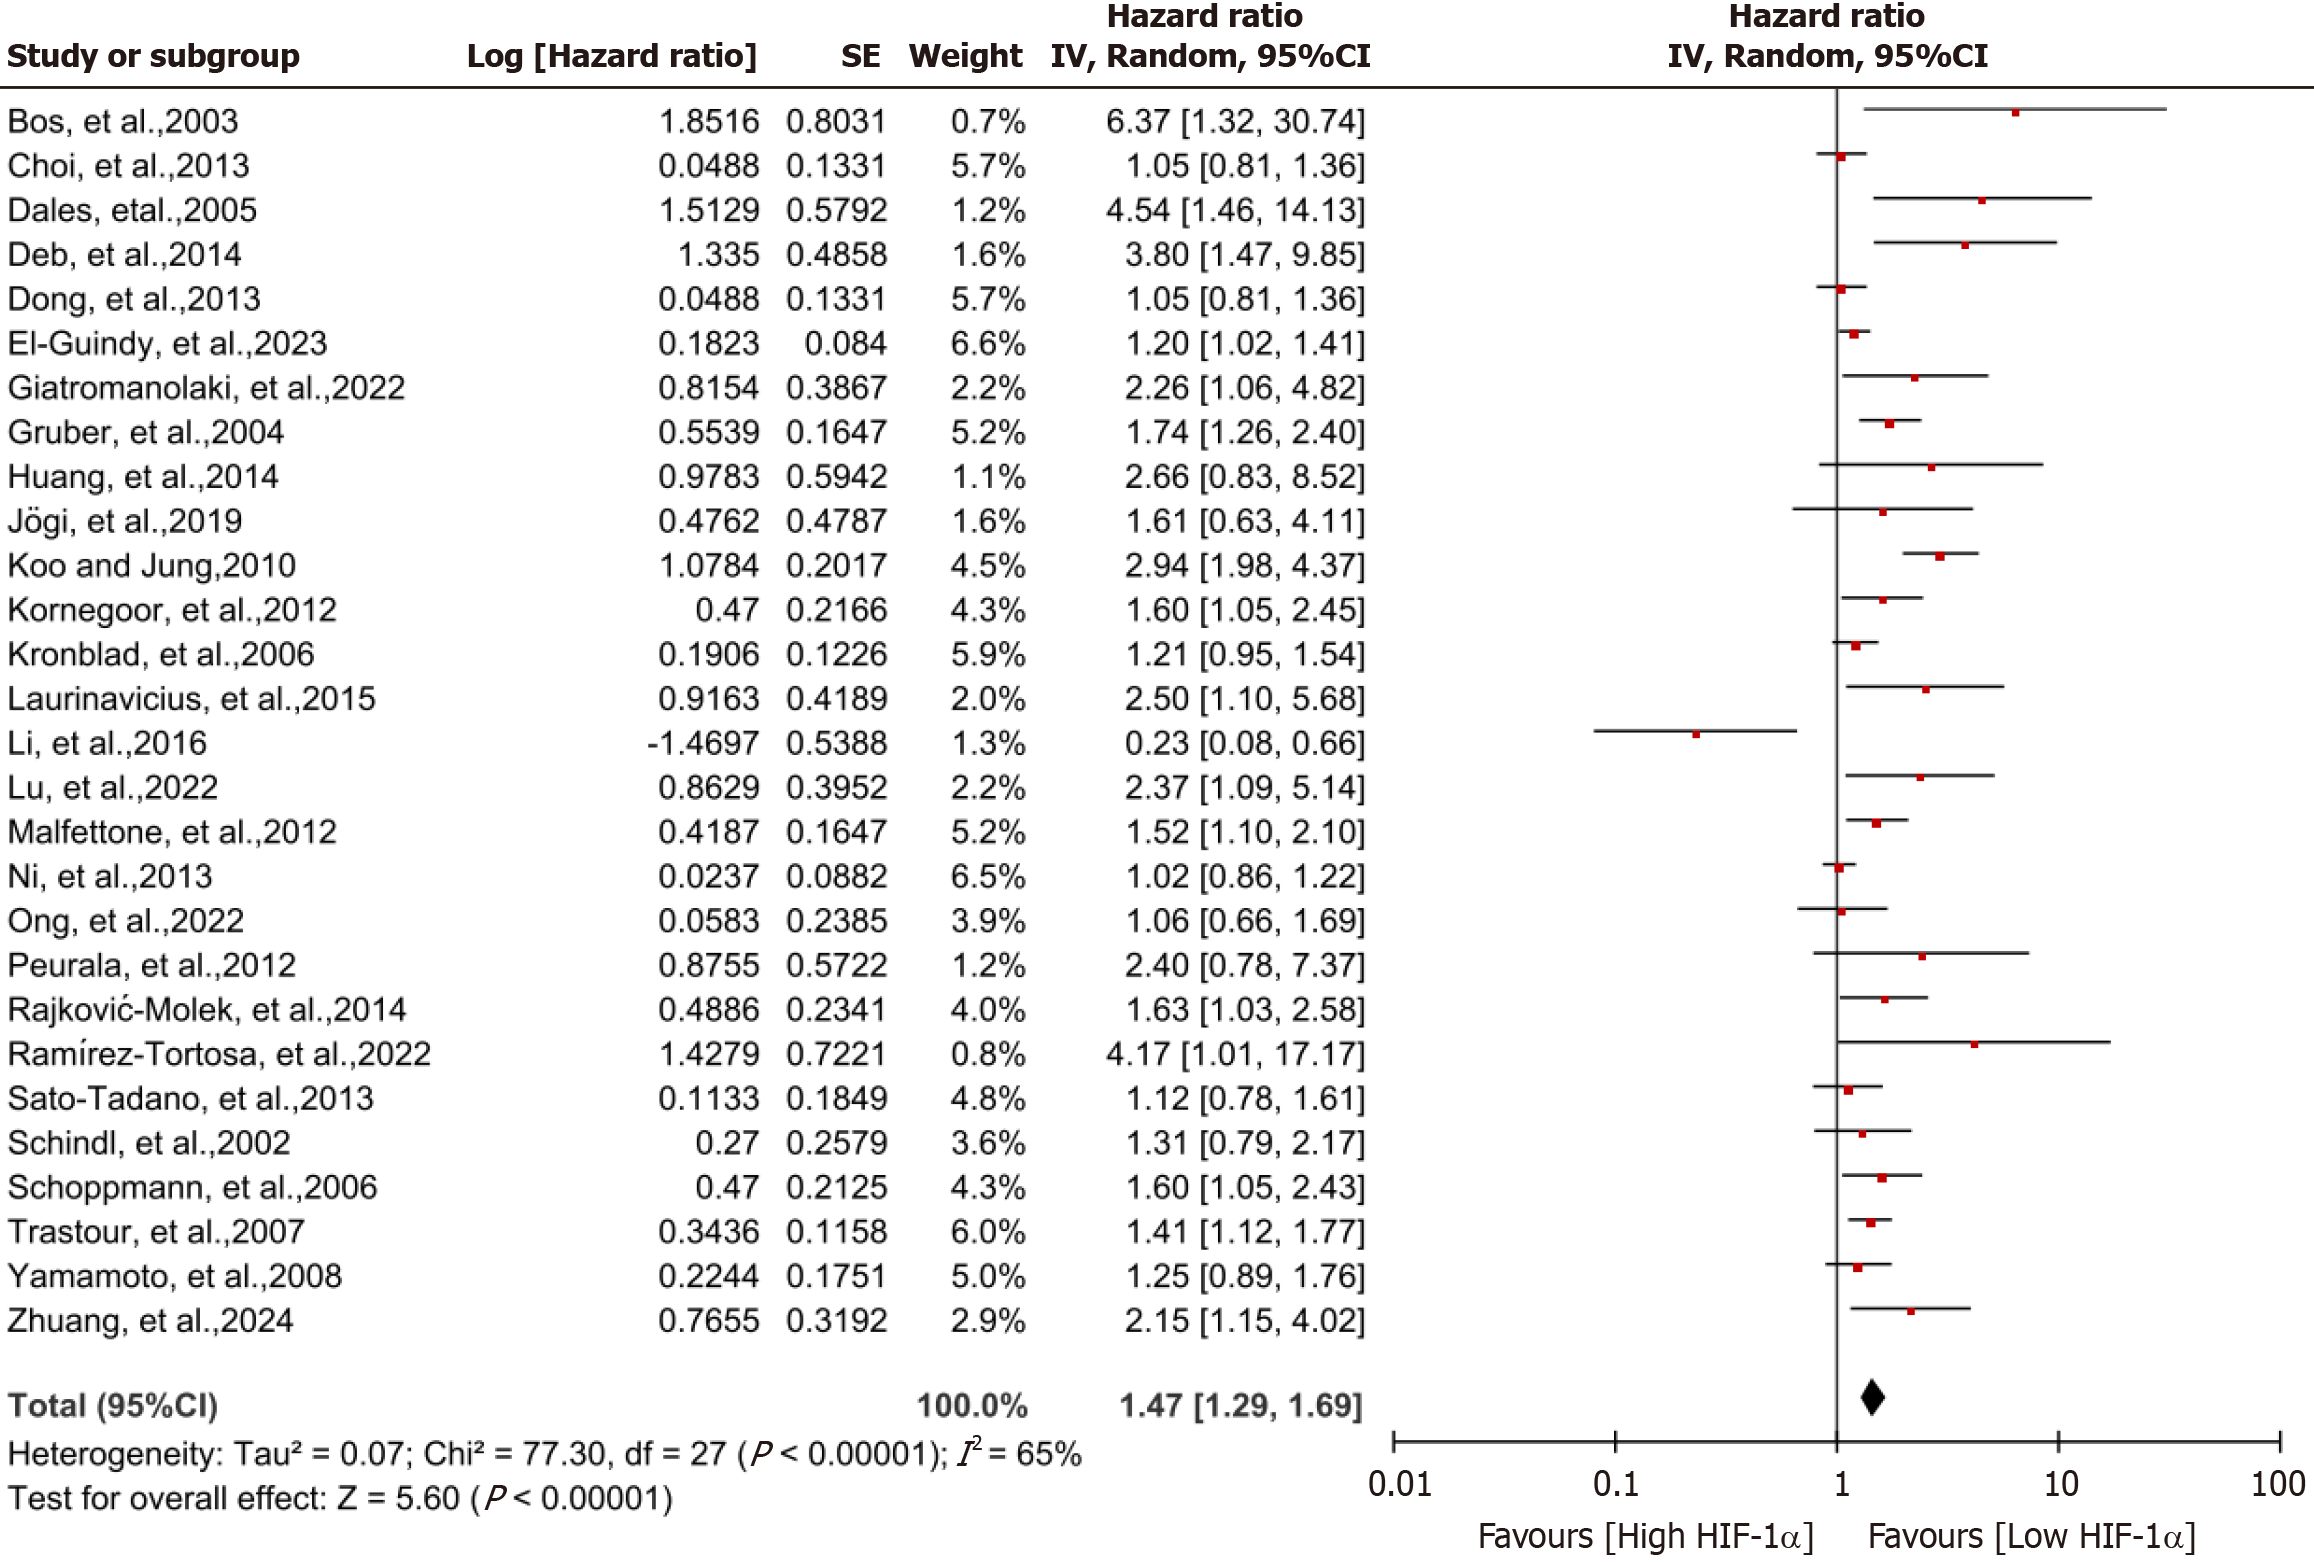
Figure 2 Forest plot of hypoxia-inducible factor 1α-positive and negative phenotypes compared on overall survival in breast cancer patients.
Risk ratios and associated 95% confidence intervals were calculated using a random-effects model. CI: Confidence interval.
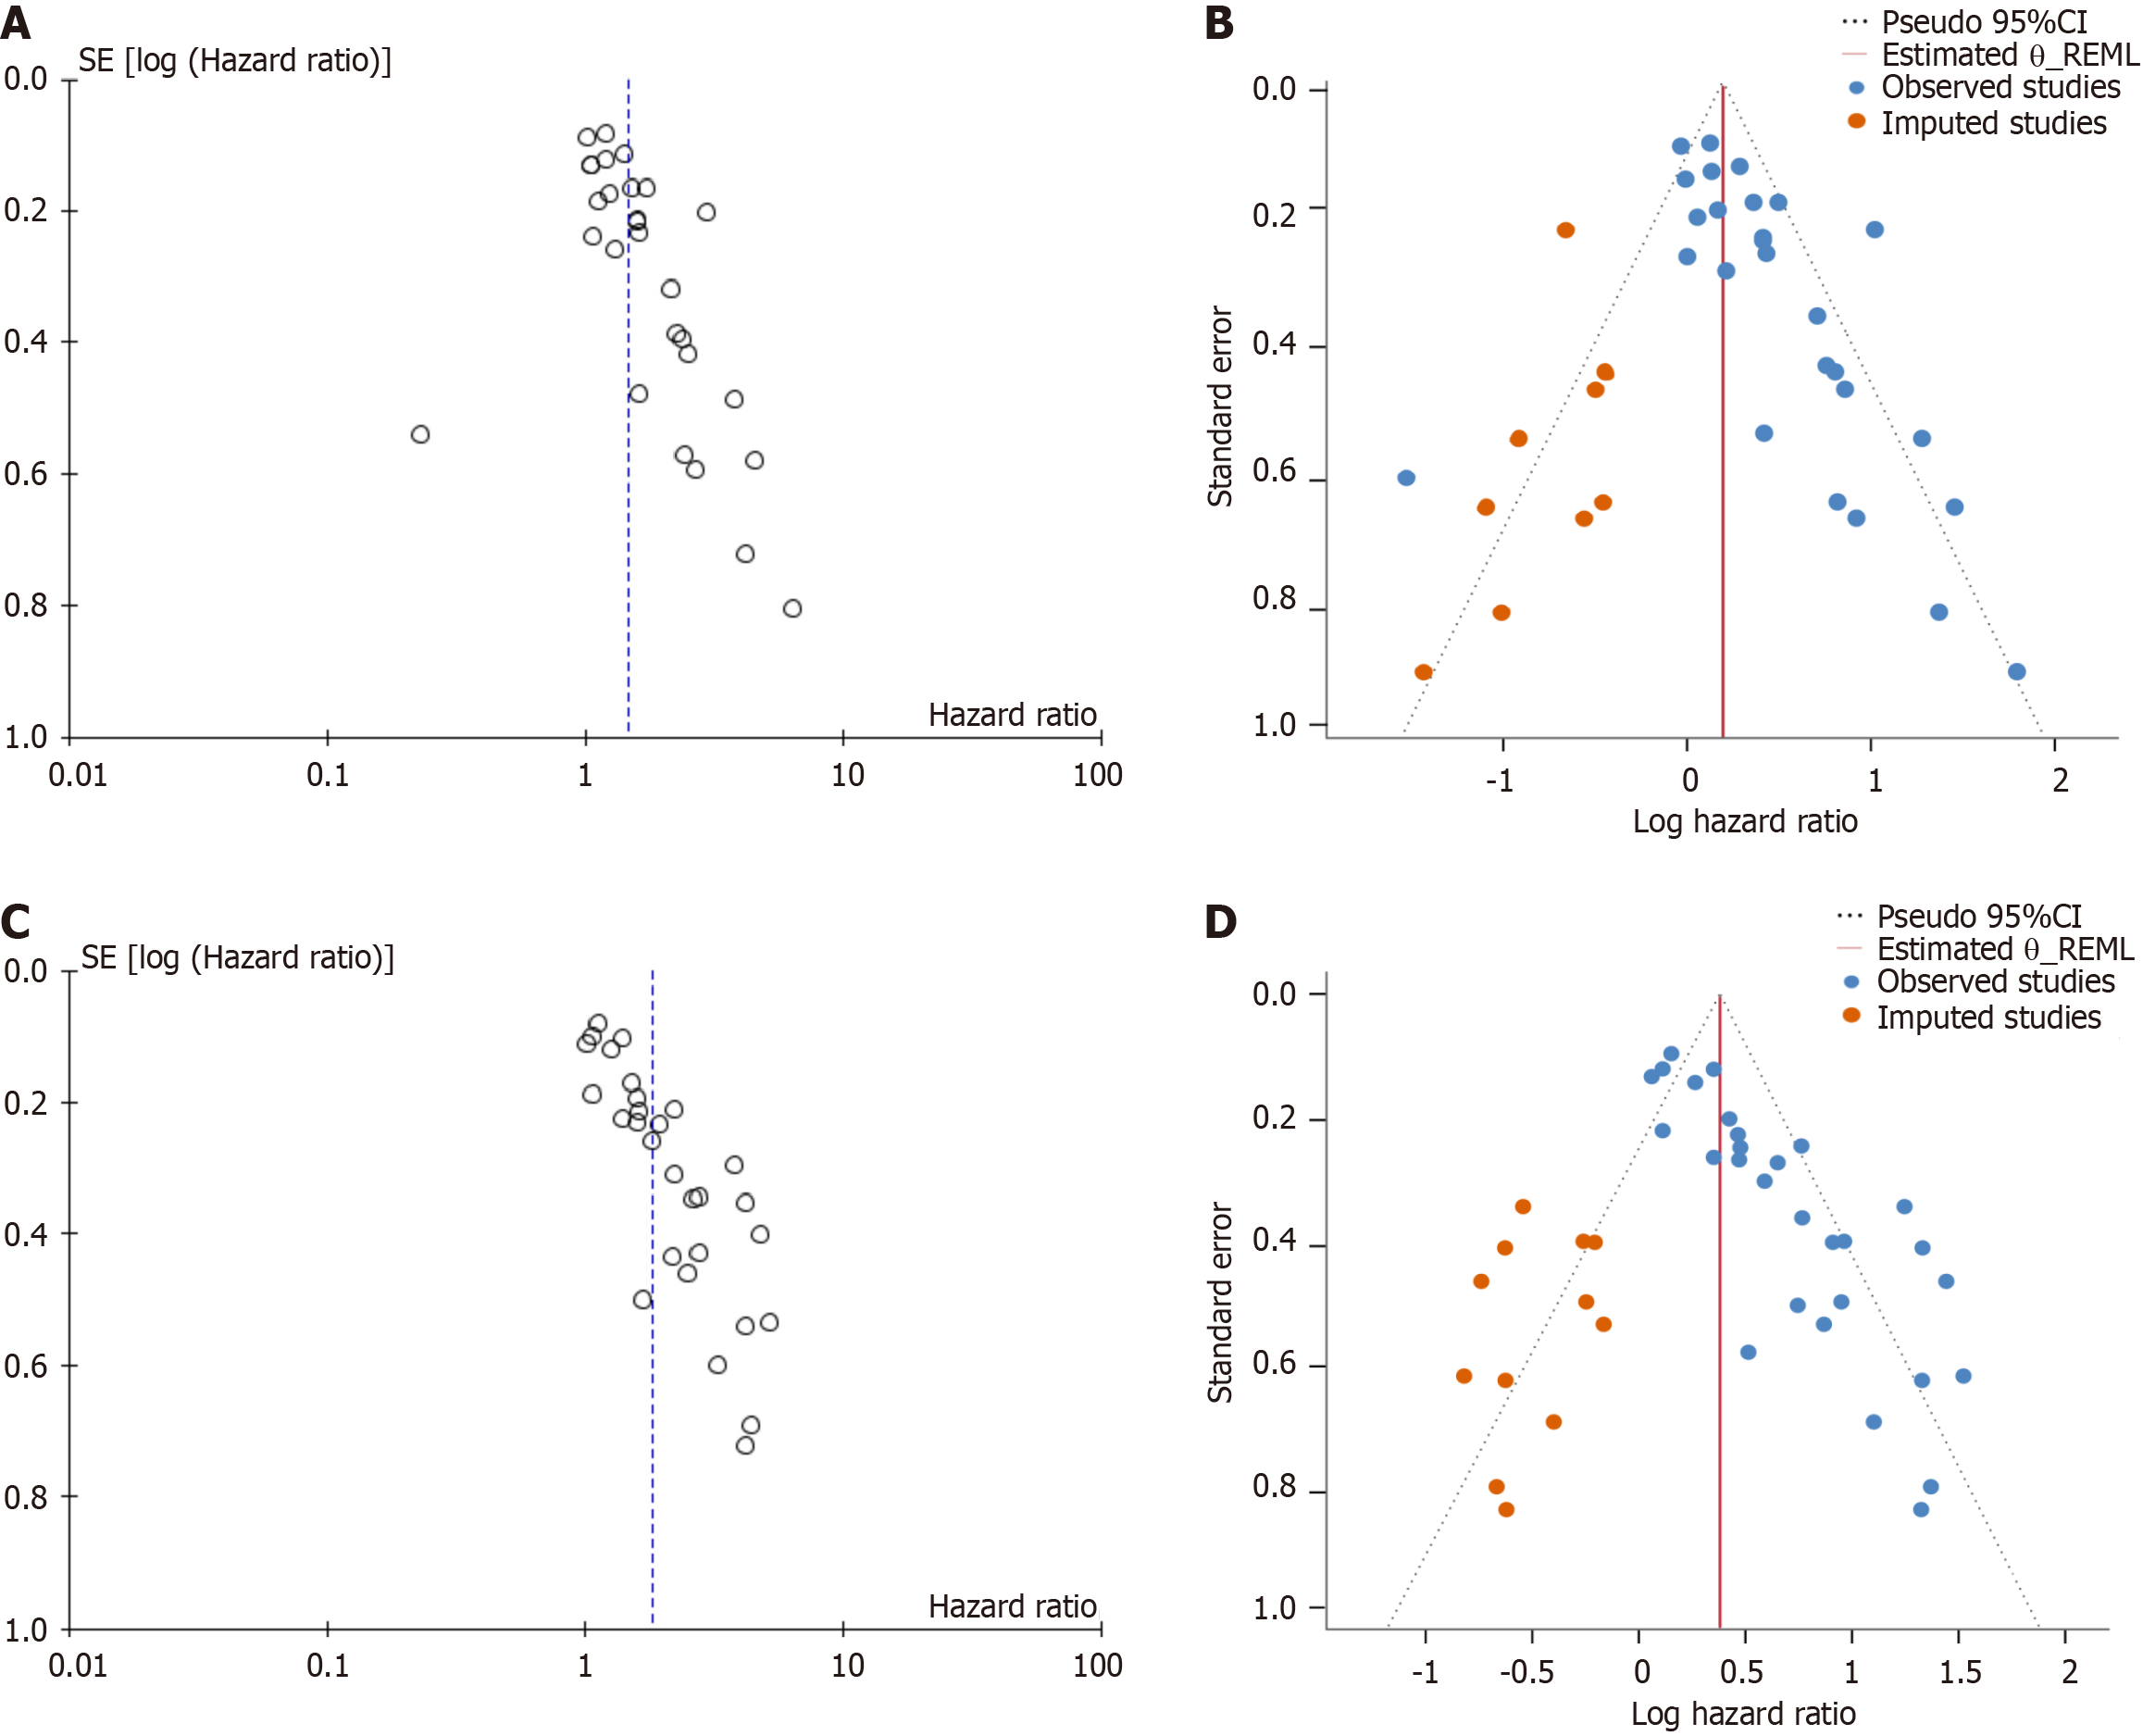
Figure 3 Funnel plot illustrates the correlation between hypoxia-inducible factor 1α expression levels and breast cancer prognosis.
A: Correlation of high hypoxia-inducible factor 1α expression in overall survival in breast cancer patients. An asymmetric funnel plot and Egger’s test P value (P = 0.02) less than 0.05 suggested potential publication bias in the included studies of overall meta-analysis; B: The trim-and-fill method analysis showed that there was no significant asymmetry in the trimmed funnel plot, and the relevant overall survival meta-analysis effect size remained significant after adjusting for publication bias; C: Correlation of high hypoxia-inducible factor 1α expression in disease-free survival in breast cancer patients. An asymmetric funnel plot and Egger’s test P value (P = 0.001) less than 0.05 suggested potential publication bias in the included studies of overall meta-analysis; D: The trim-and-fill method analysis showed that there was no significant asymmetry in the trimmed funnel plot, and the relevant disease-free survival meta-analysis effect size remained significant after adjusting for publication bias. OS: Overall survival; DFS: Disease-free survival; CI: Confidence interval.
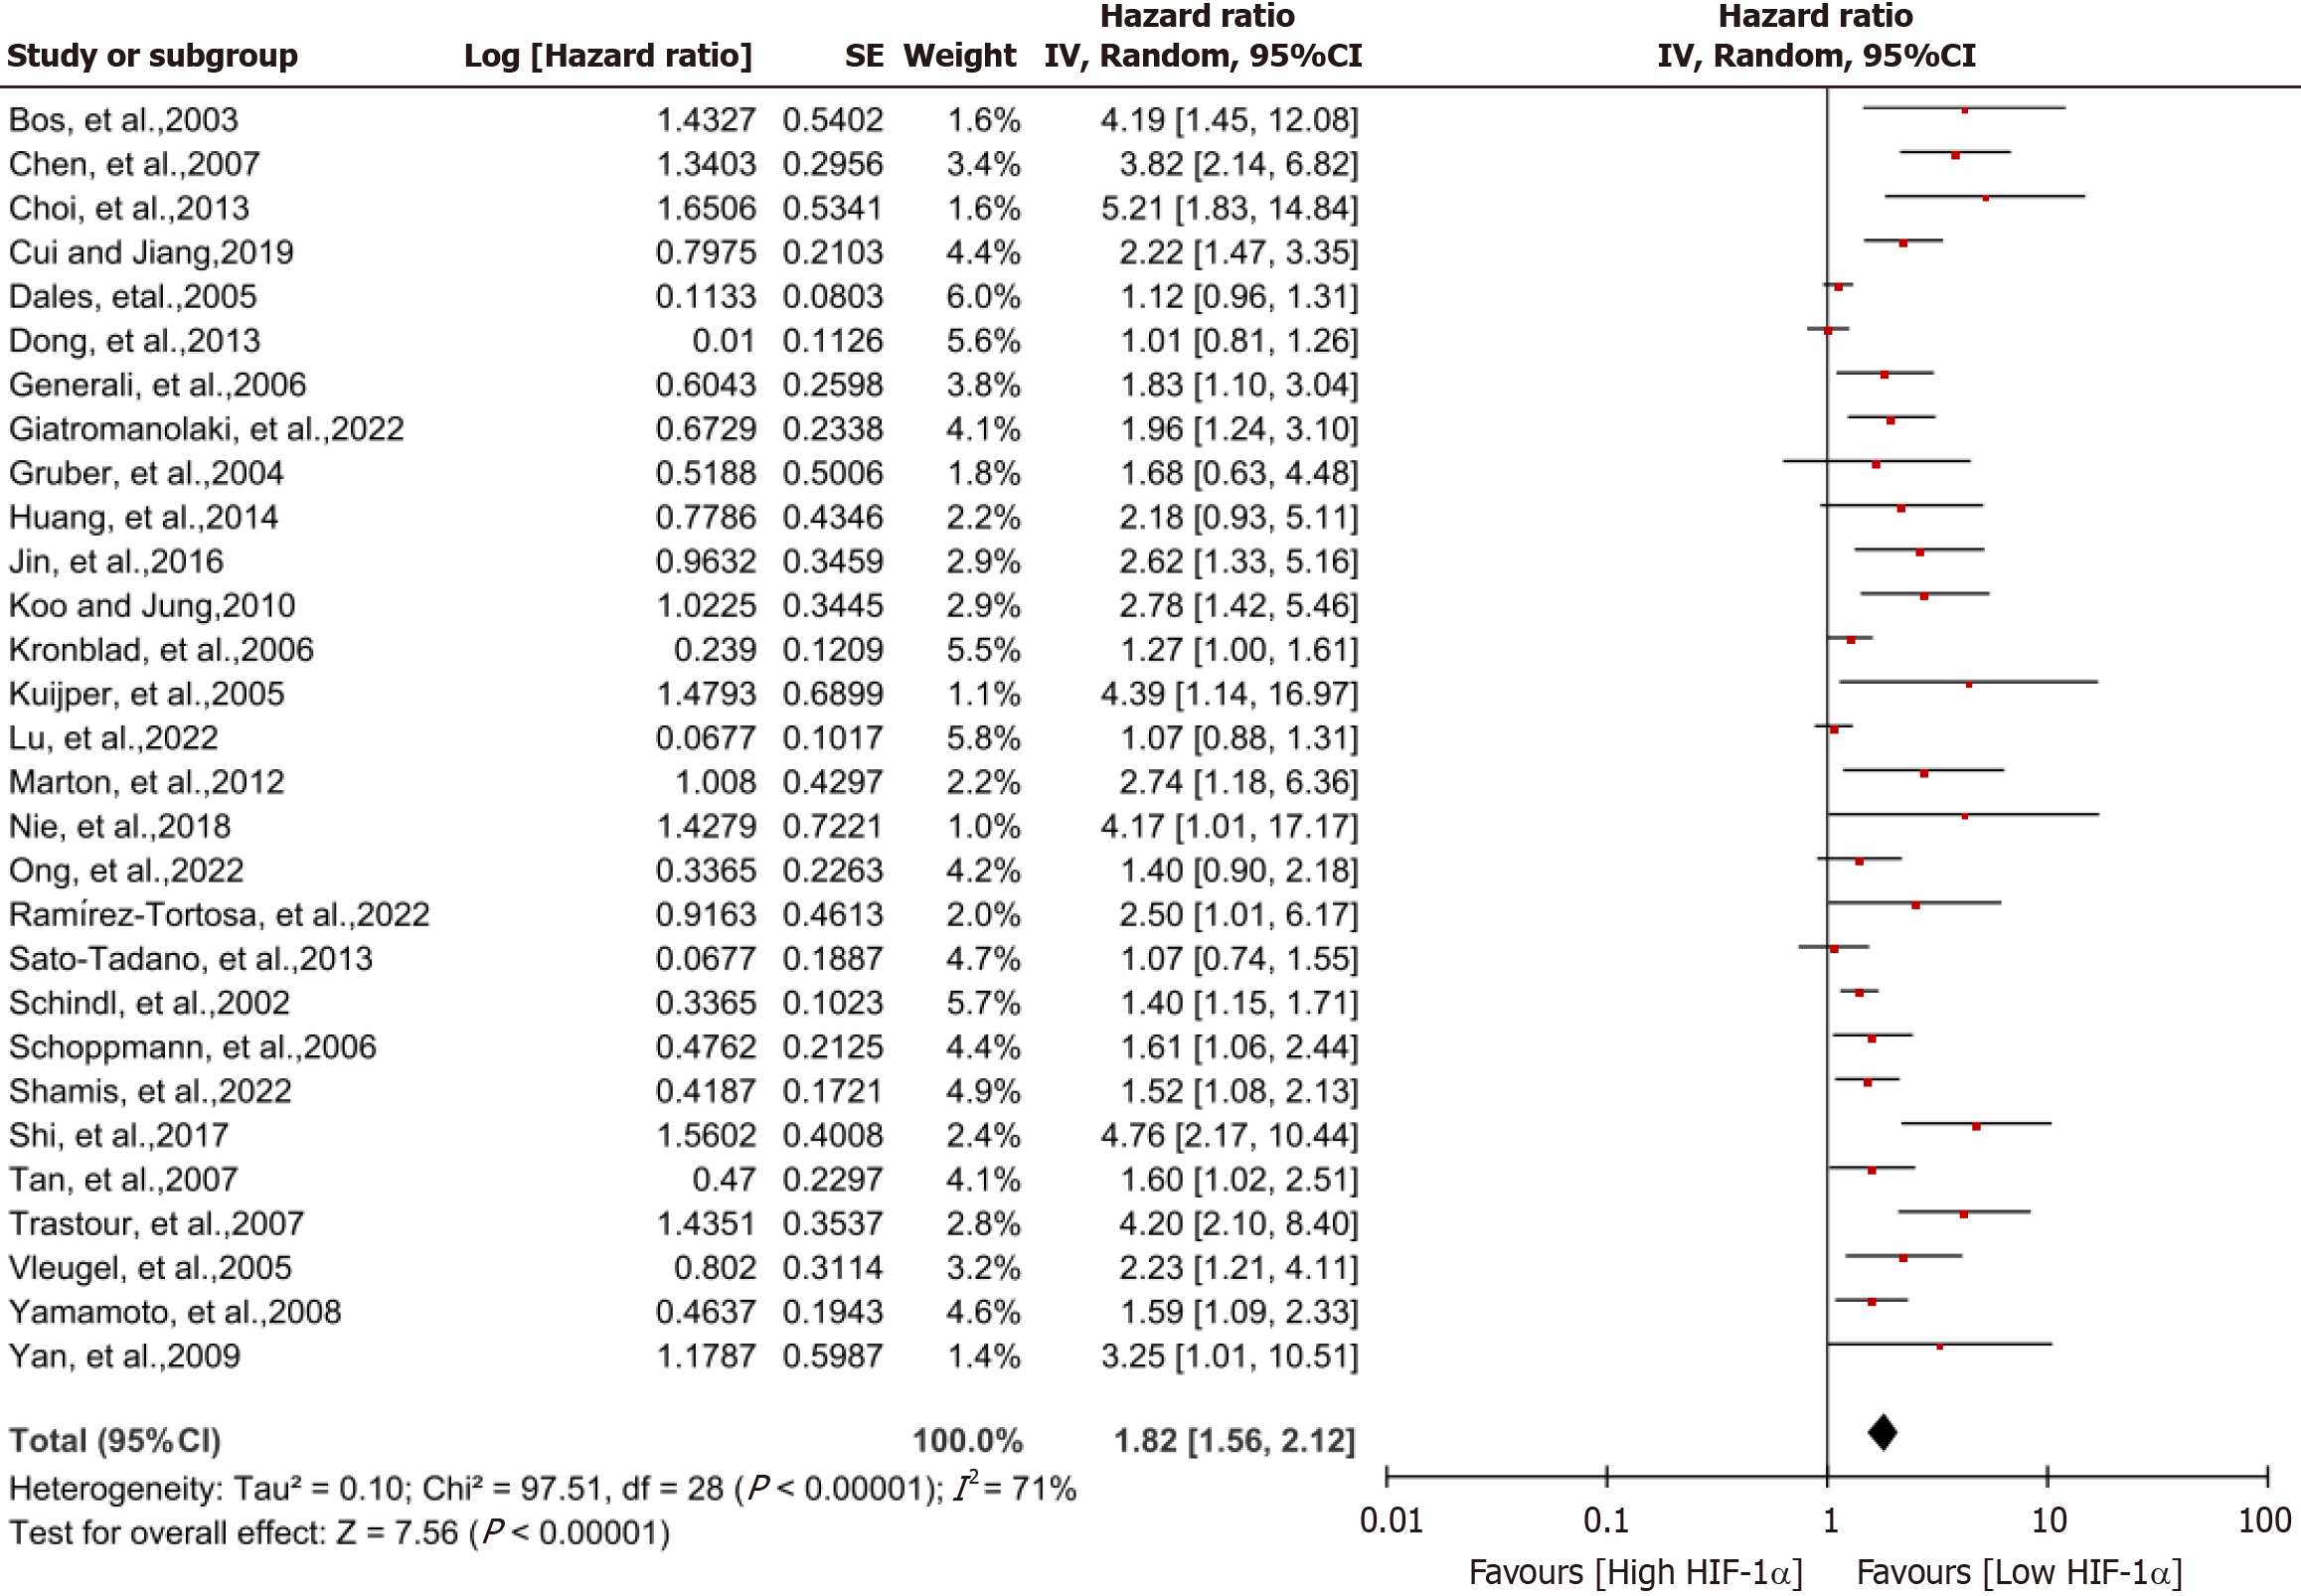
Figure 4 Forest plot of hypoxia-inducible factor 1α positive and negative phenotypes compared on disease-free survival in breast cancer patients.
Risk ratios and associated 95% confidence intervals were calculated using a random-effects model. CI: Confidence interval.
- Citation: Zheng XD, Li HY, Gao SY, Wang Q, Liu JB. High hypoxia inducible factor-1α expression is associated with reduced survival in patients with breast cancer: A meta-analysis. World J Clin Oncol 2025; 16(6): 105691
- URL: https://www.wjgnet.com/2218-4333/full/v16/i6/105691.htm
- DOI: https://dx.doi.org/10.5306/wjco.v16.i6.105691


