Copyright
©The Author(s) 2022.
World J Clin Oncol. Jun 24, 2022; 13(6): 540-552
Published online Jun 24, 2022. doi: 10.5306/wjco.v13.i6.540
Published online Jun 24, 2022. doi: 10.5306/wjco.v13.i6.540
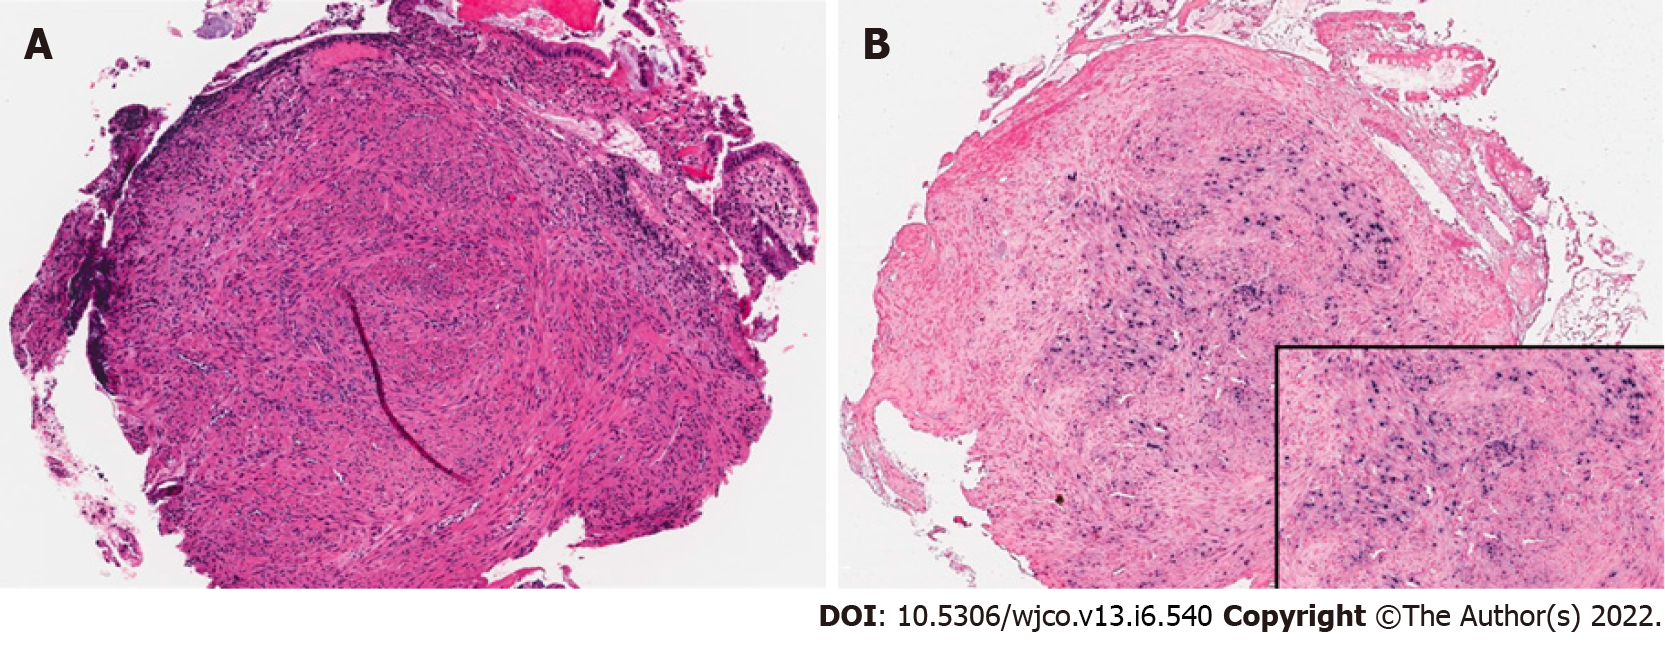
Figure 1 Epstein-Barr virus associated smooth muscle tumor in the sigmoid colon in case 1.
A: Proliferation of smooth muscle cells undermining and distorting the colonic mucosa (HE stain, 70 x); B: Epstein-Barr virus-encoded small RNA in situ hybridization is positive within the smooth muscle cell population (70 x, inset box 200 x).
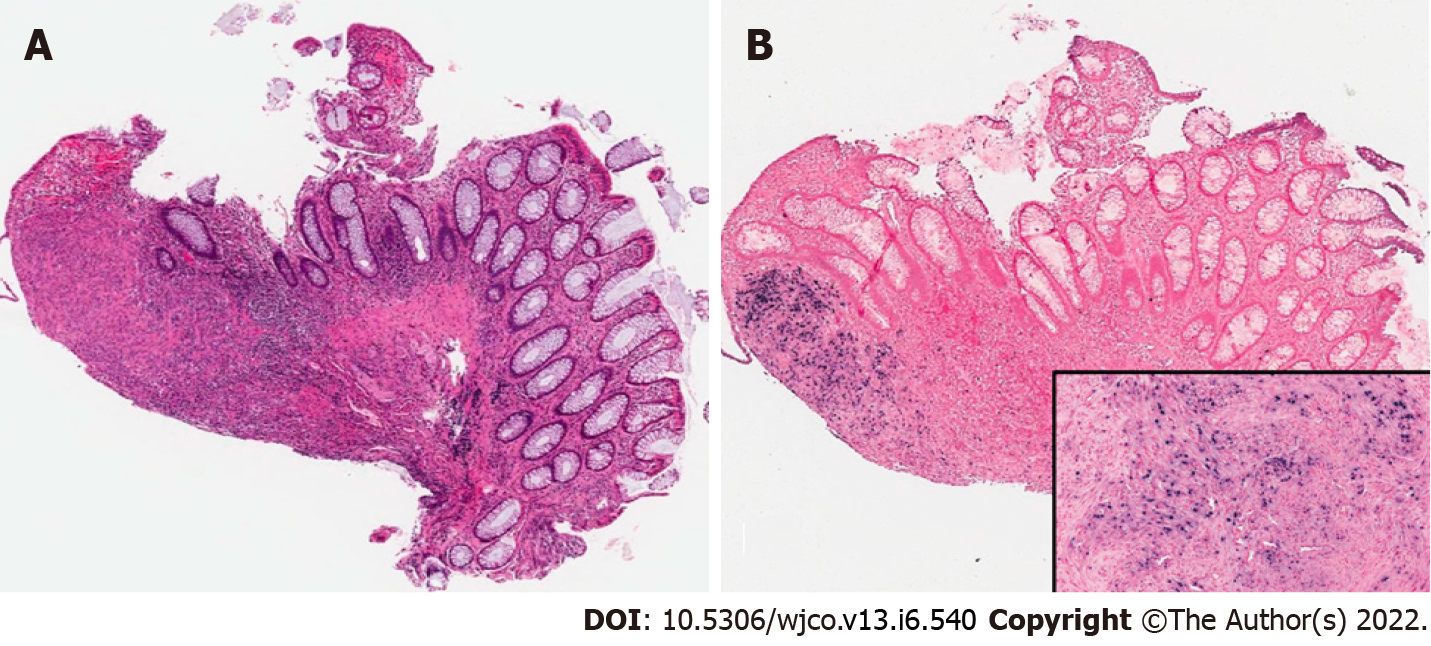
Figure 2 Epstein-Barr virus associated smooth muscle tumor in the rectum in case 1.
A: Proliferation of smooth muscle cells undermining the rectal mucosa (HE stain, 40 x); B: Epstein-Barr virus-encoded small RNA in situ hybridization is positive within the smooth muscle cell population (40 x, inset box 200 x).
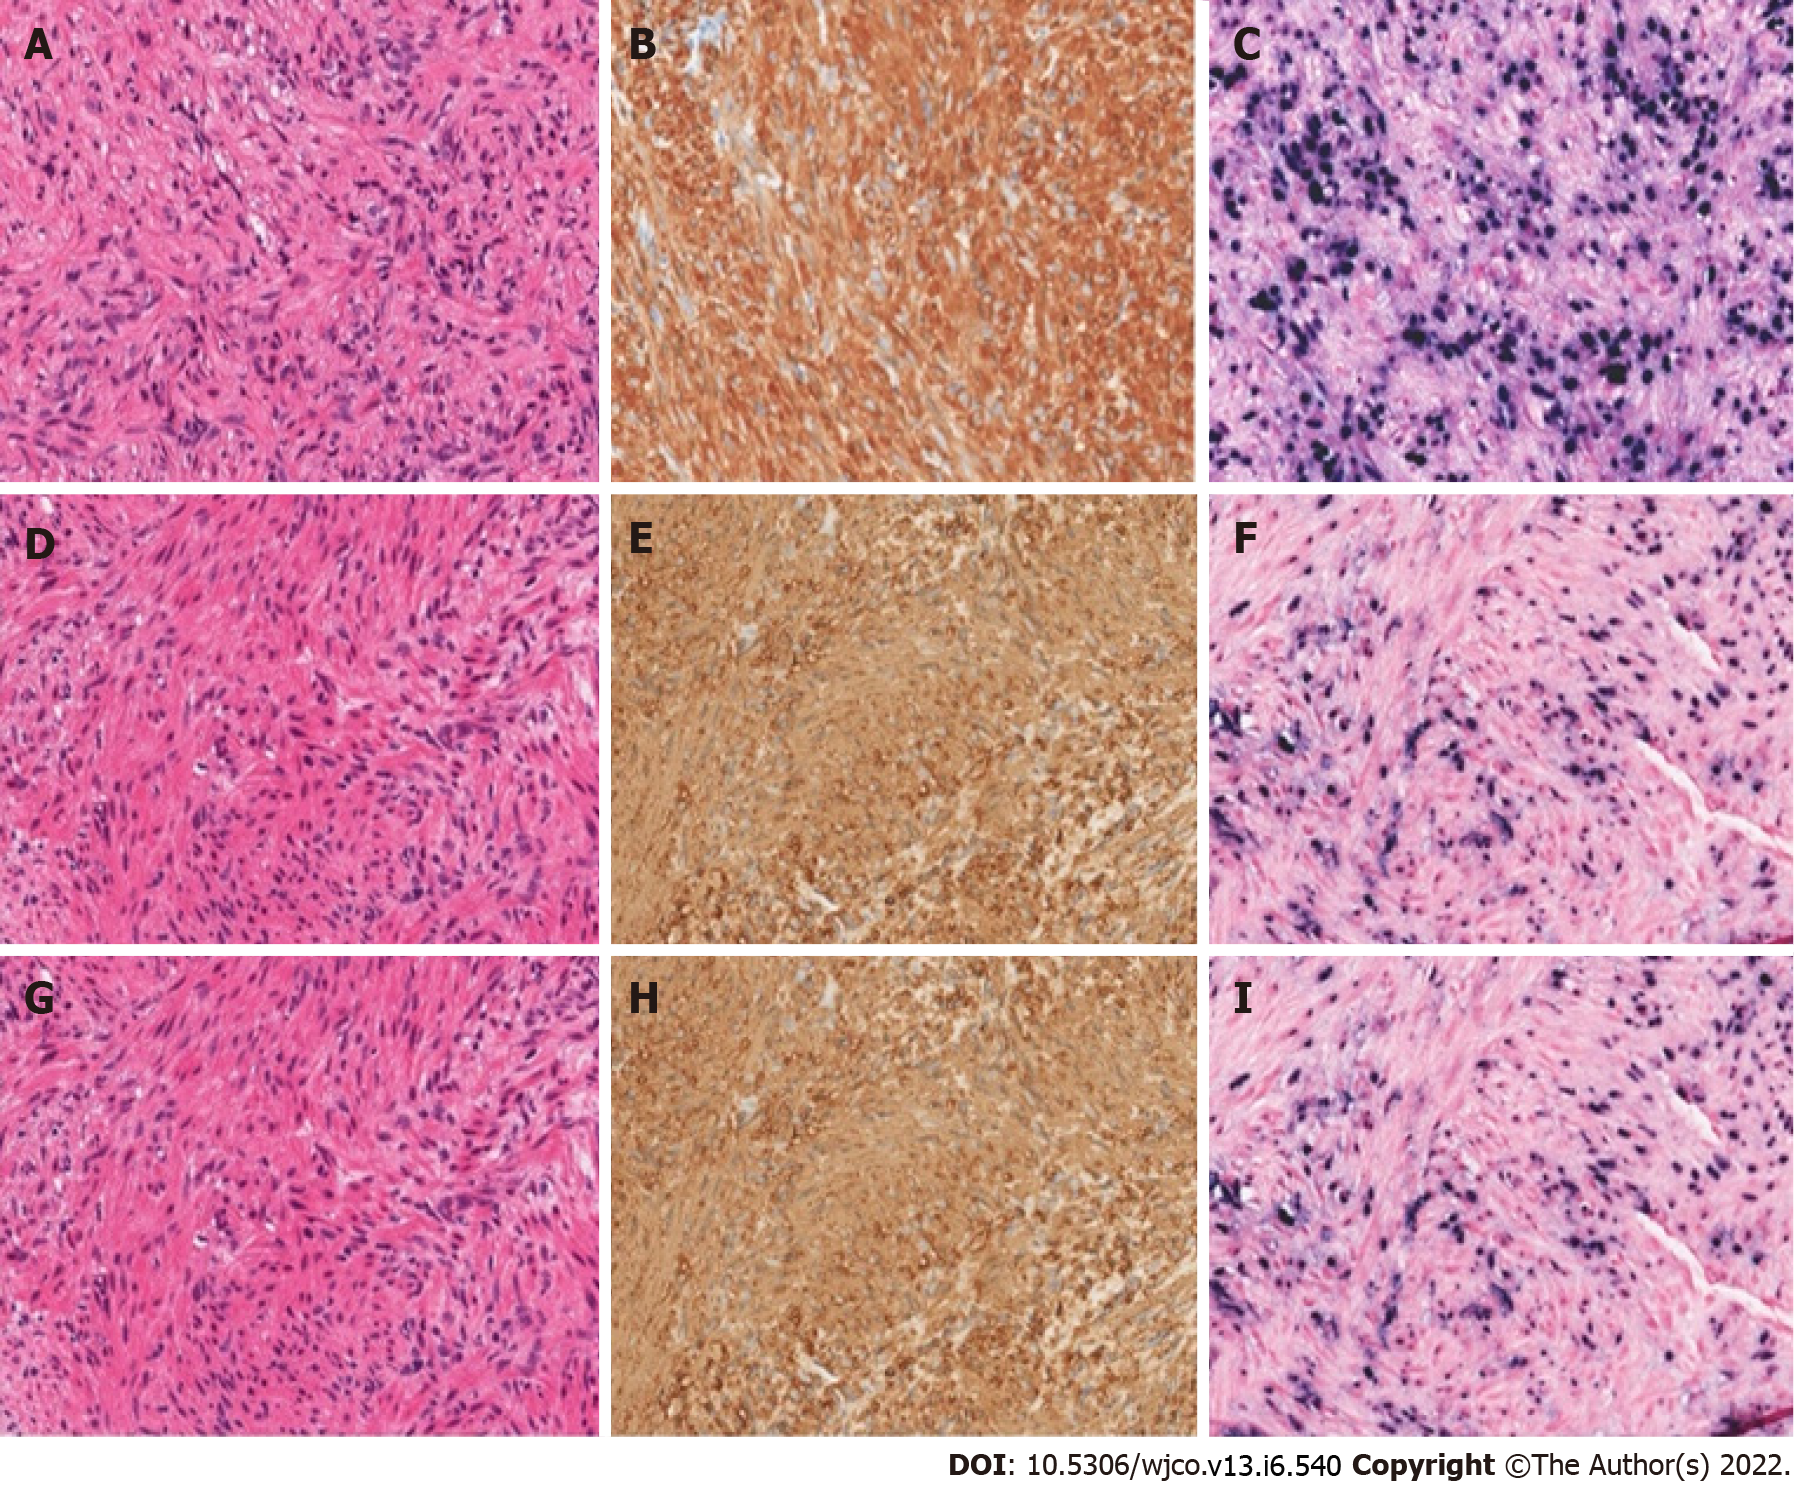
Figure 3 Epstein-Barr virus associated smooth muscle tumor liver biopsies for cases 2-4 (HE stain, 200 x).
Hematoxylin and eosin-stained tissue sections showed fascicles of well-differentiated spindle cells with pale eosinophilic cytoplasm and blunt-ended, ovoid nuclei with smooth nuclear contours. A, D, G: No significant cytologic atypia or nuclear pleomorphism is appreciated; B, E, H: All three cases show strong, diffuse reactivity for smooth muscle actin, confirming smooth muscle differentiation, confirming smooth muscle tumor lineage; C, F, I: Chromogenic in situ hybridization studies for the Epstein-Barr virus-encoded small RNA confirm the presence of viral genetic material in all three cases.
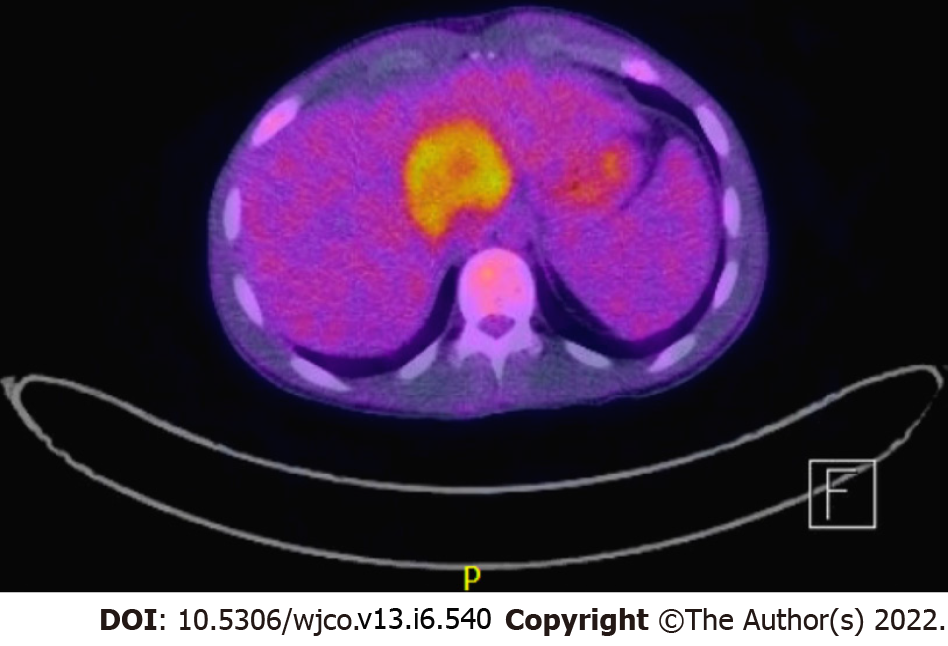
Figure 4 Positron emission tomography scan showing a hypermetabolic mass arising from the medial segment of the left liver lobe, measuring about 5.
1 cm x 4.7 cm in the axial and anteroposterior dimension and 6.9 cm in the craniocaudal dimension in case 2.
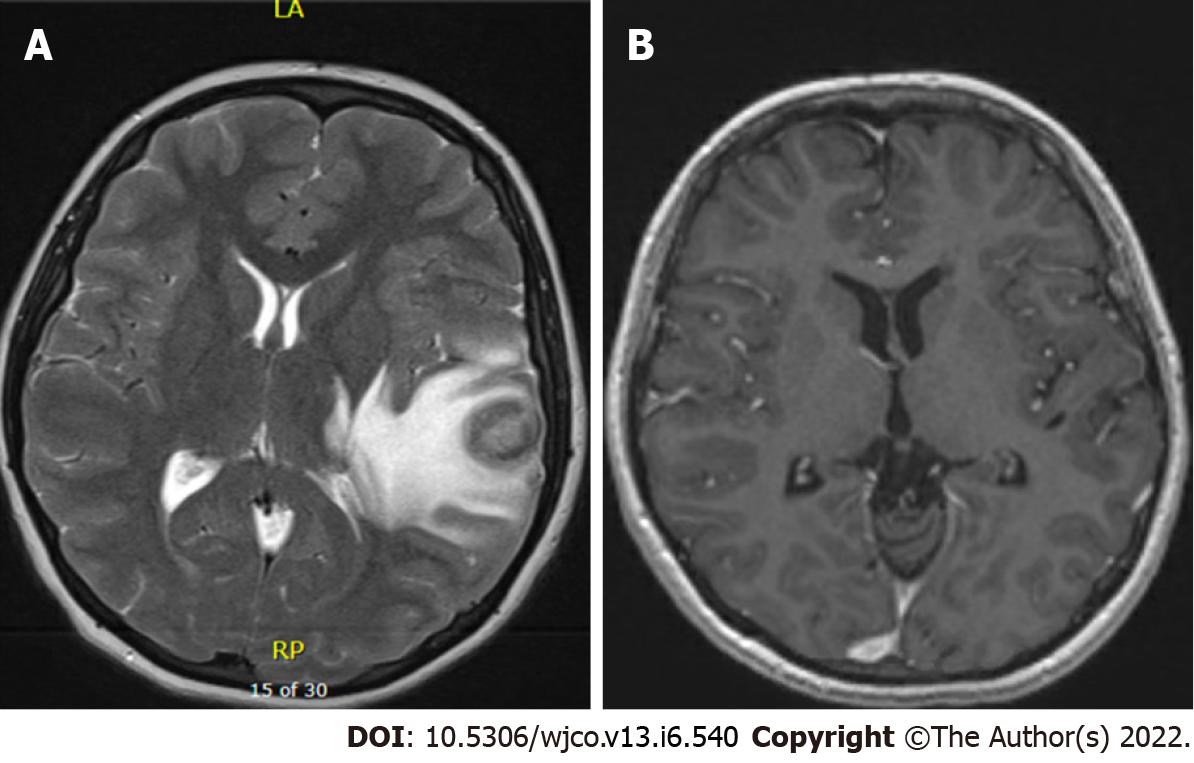
Figure 5 Magnetic resonance imaging brain.
A: T2 weighted turbo spin echo magnetic resonance images of the brain showing ring-enhancing lesion in the left temporal region in case 3; B: T1 Fl3d magnetic resonance images of the brain showing resolution of ring-enhancing lesion six years post-treatment in case 3.
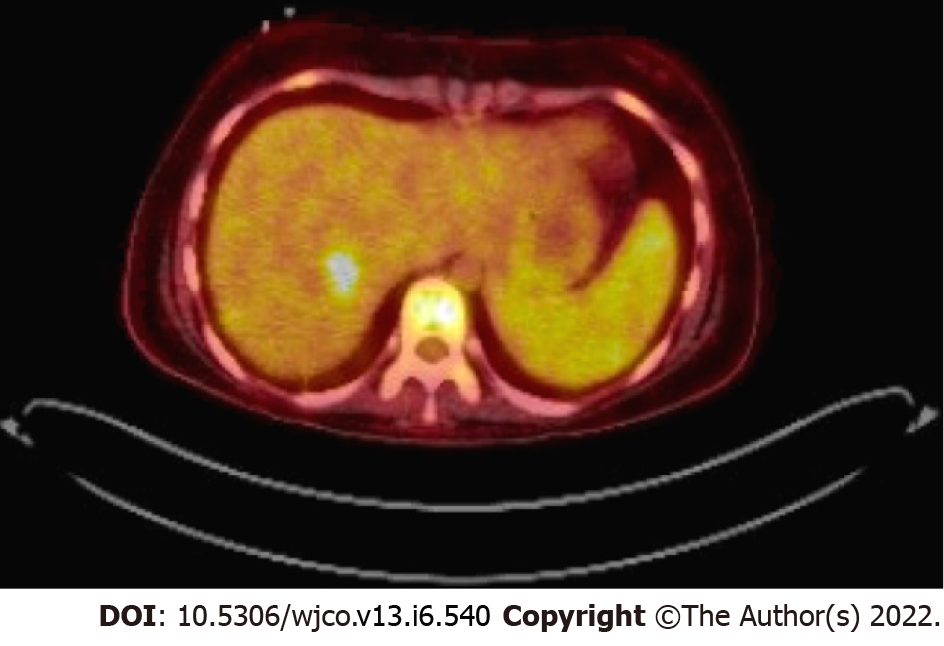
Figure 6 Positron emission tomography scan showing a hypermetabolic right hepatic mass in case 3.
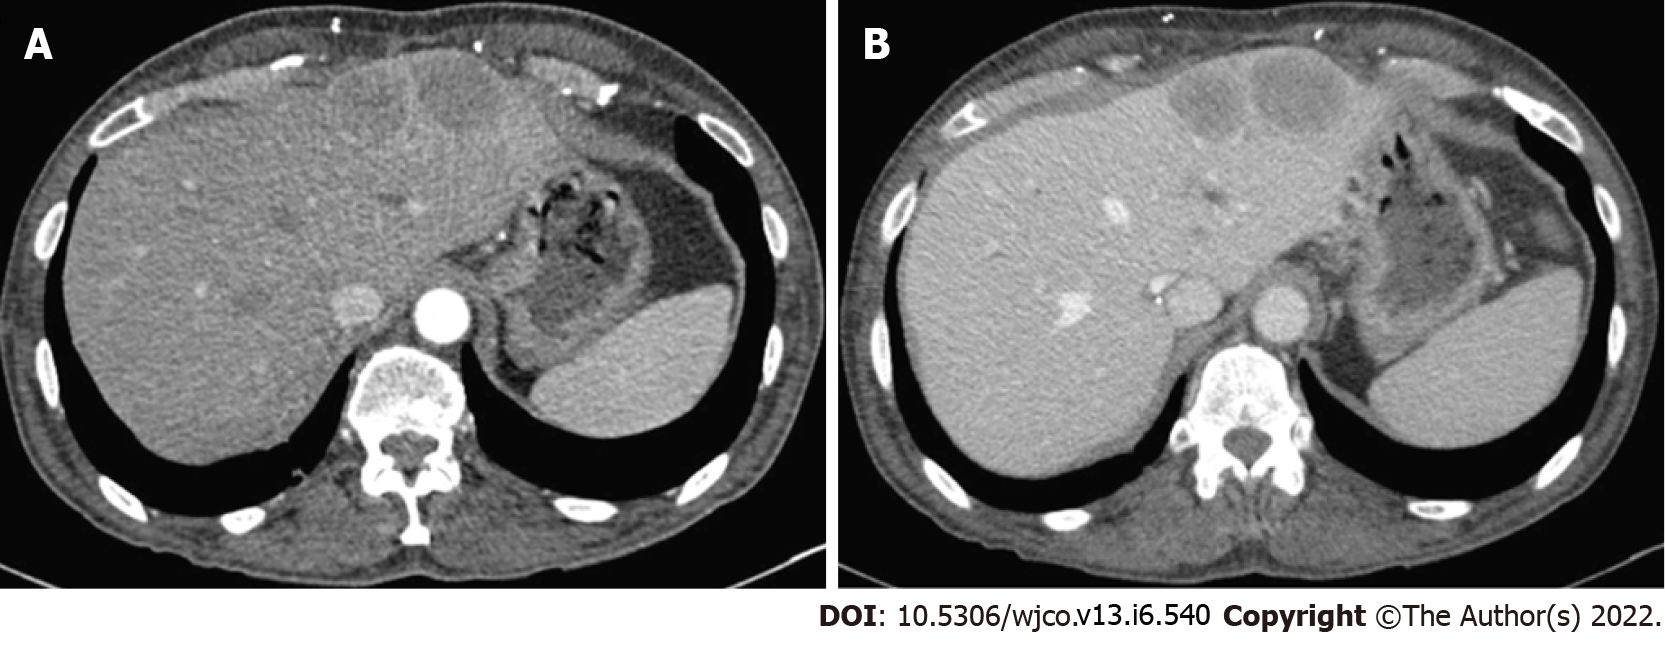
Figure 7 Computed tomography scan.
A: The liver with intravenous contrast in arterial phase showing multiple hepatic lesions in case 4; B: The liver in venous phase showing multiple hepatic lesions in case 4.
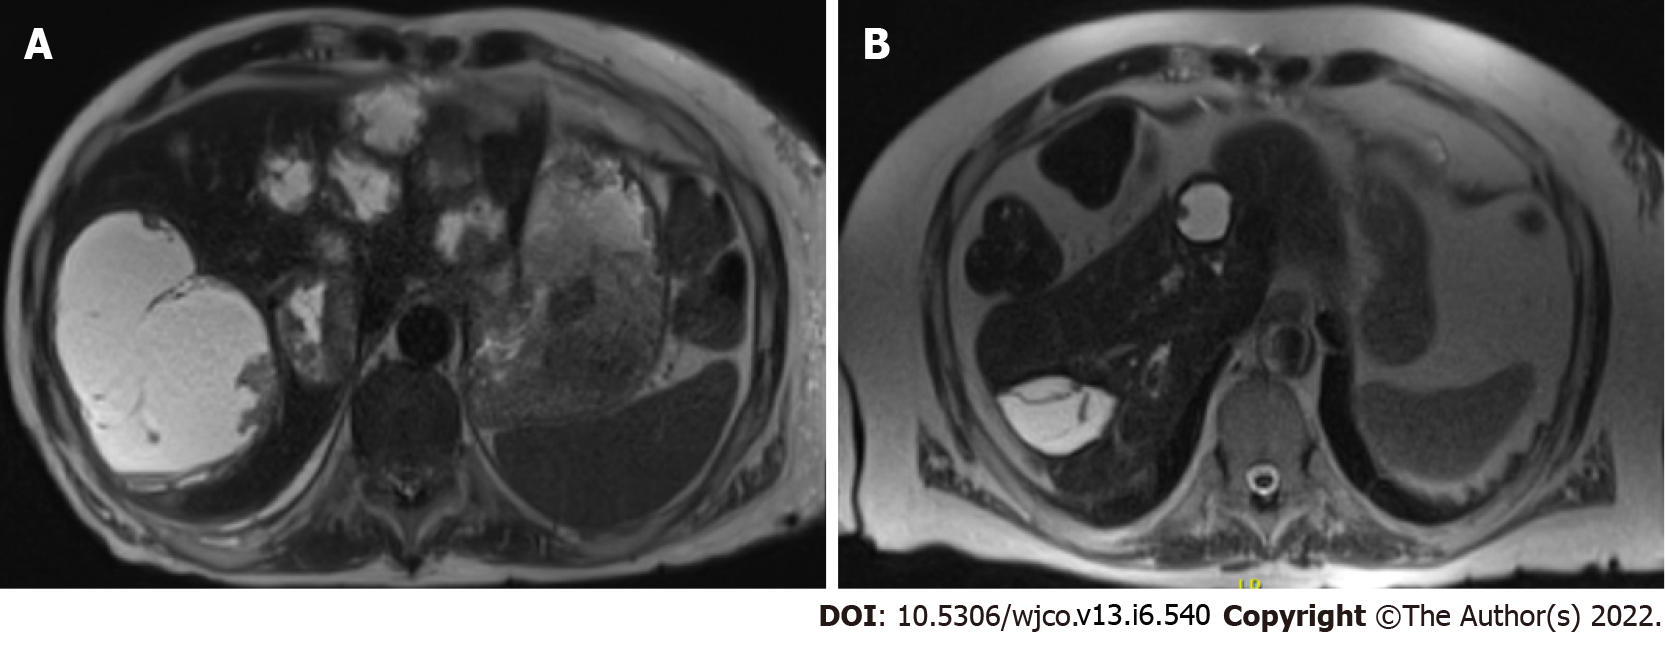
Figure 8 Axial HASTE sequence abdominal magnetic resonance imaging.
A: demonstrating numerous cystic appearing hepatic Epstein-Barr virus associated smooth muscle tumors, including the largest lesion in segment VII in case 5; B: Demonstrating stable/deceased hepatic lesions with no new lesions in case 5.
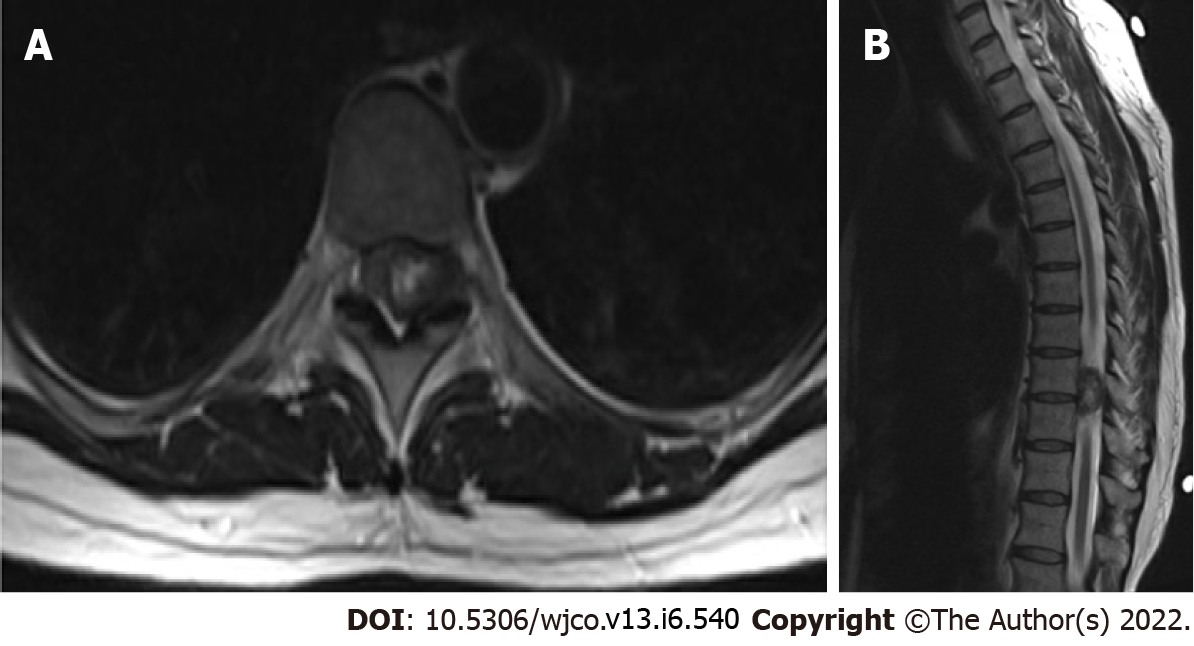
Figure 9 Axial (A) and sagittal (B) cuts of a T2 weighted magnetic resonance imaging of the thoracic spine demonstrating an Epstein-Barr virus associated smooth muscle tumor centered in the left T9/T10 neuroforamina with a rightward displacement of the spinal cord in case 6.
- Citation: Khan AA, Estfan BN, Yalamanchali A, Niang D, Savage EC, Fulmer CG, Gosnell HL, Modaresi Esfeh J. Epstein-Barr virus-associated smooth muscle tumors in immunocompromised patients: Six case reports. World J Clin Oncol 2022; 13(6): 540-552
- URL: https://www.wjgnet.com/2218-4333/full/v13/i6/540.htm
- DOI: https://dx.doi.org/10.5306/wjco.v13.i6.540


