Copyright
©The Author(s) 2019.
World J Clin Oncol. Jul 24, 2019; 10(7): 256-268
Published online Jul 24, 2019. doi: 10.5306/wjco.v10.i7.256
Published online Jul 24, 2019. doi: 10.5306/wjco.v10.i7.256
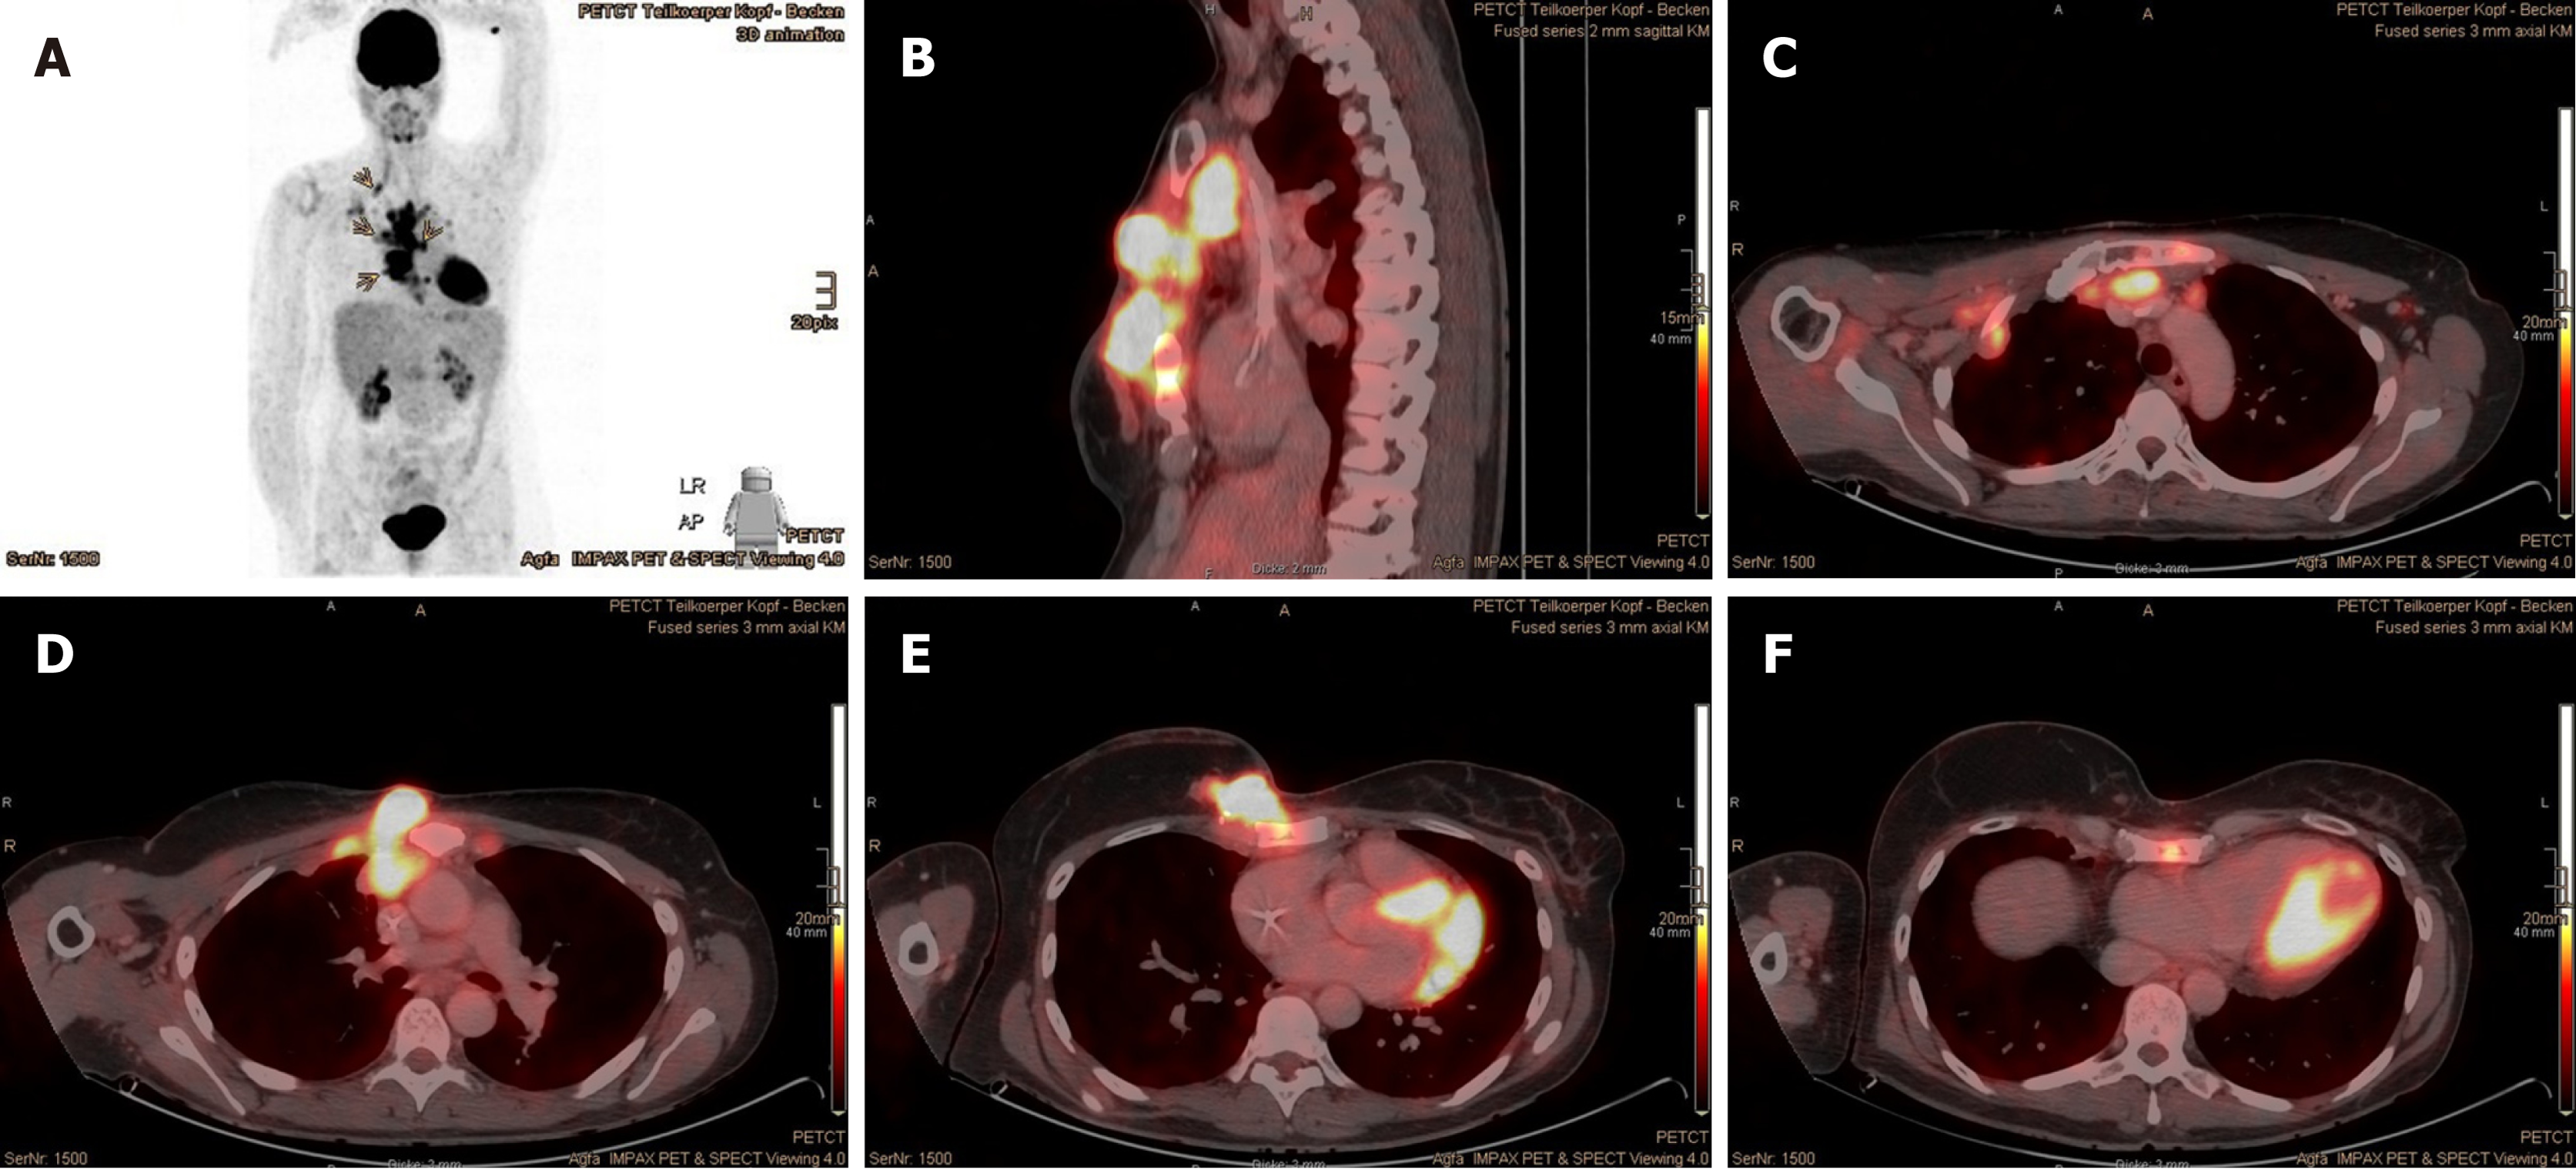
Figure 1 18F-FDG PET/CT performed immediately prior to proton beam therapy in October 2016.
A: Overview of multilocular tumor recurrences with increased FDG uptake (marked with arrows); B: Sagittal plane; C-F: Axial plane. 18F-FDG PET/CT: 2-deoxy-2-[fluorine-18] fluoro-D-glucose positron emission tomography/computed tomography.
Figure 2 Pleural metastases with aspect of lymphangiosis carcinomatosa in the right upper lobe.
A: Pleural metastasis; B: Lymphangiosis carcinomatosa (both marked with arrows).
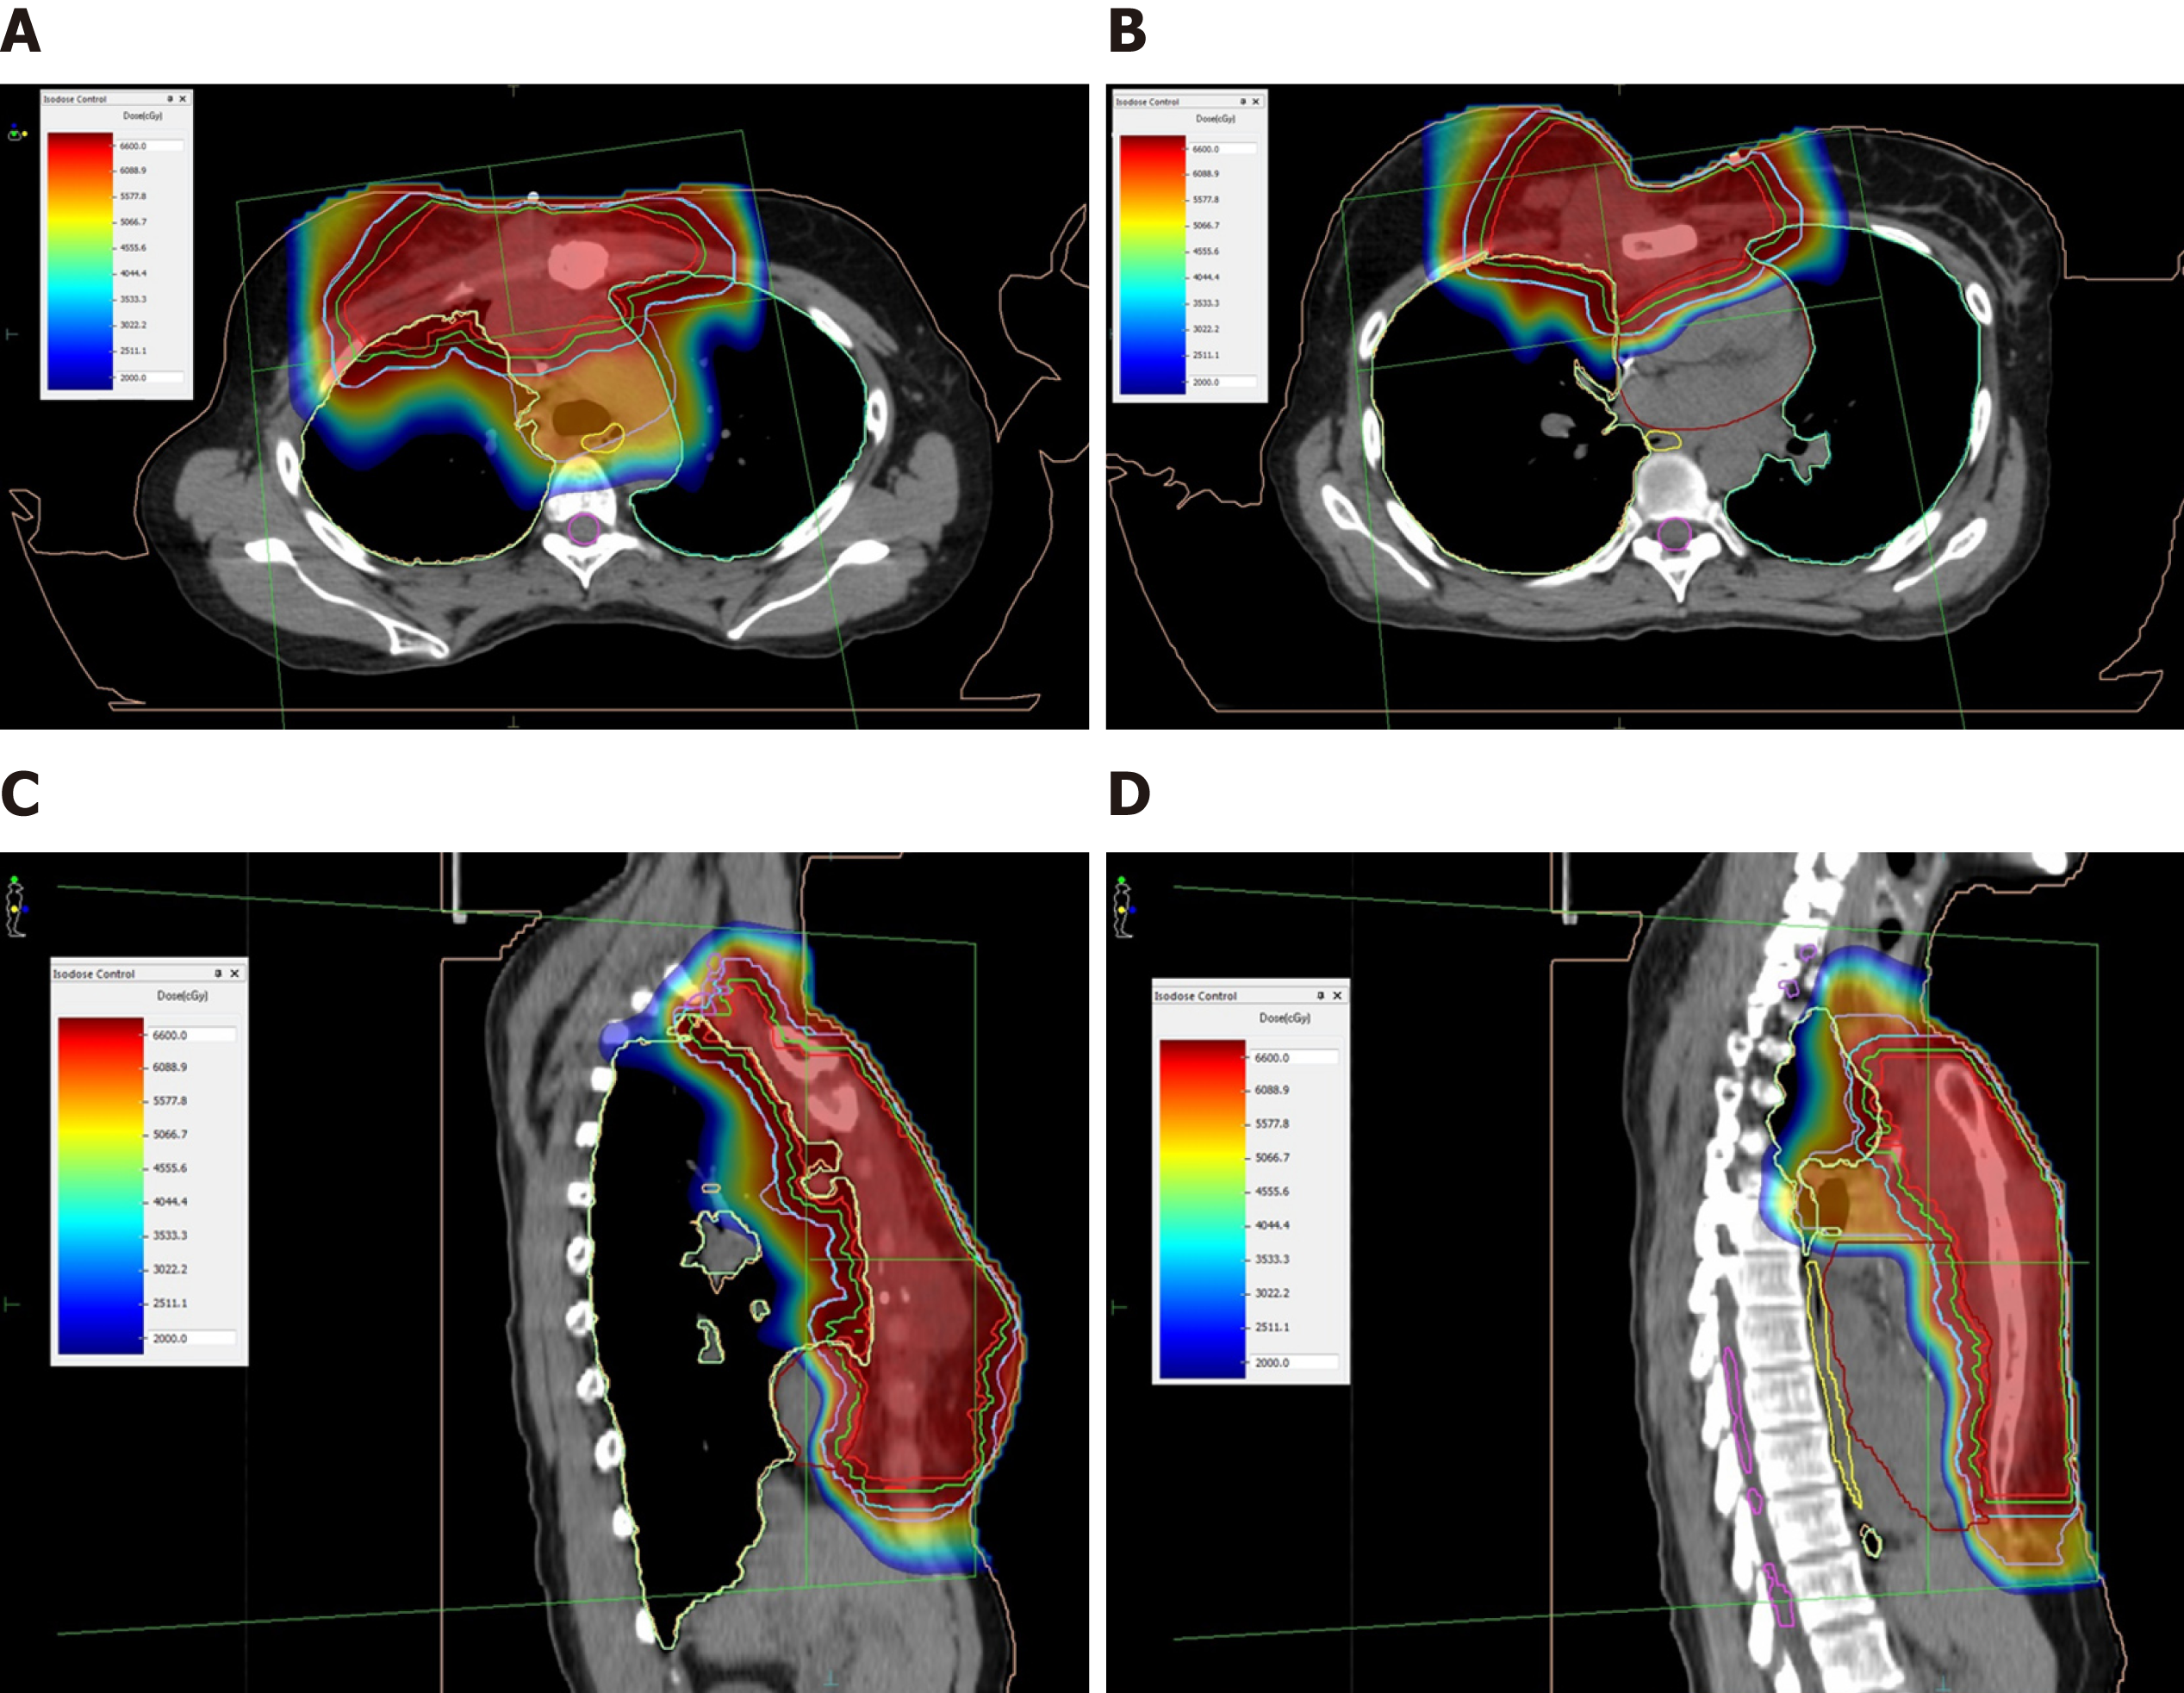
Figure 3 Treatment plan of proton beam therapy with isodose distributions.
A and B: Axial plane; C and D: Sagittal plane. Red line: Gross tumor volume; Green line: Clinical target volume; Blue line: Planning target volume of gross tumors; Lilac line: Planning target volume of gross tumors including adjacent regional lymphatics and sternum.
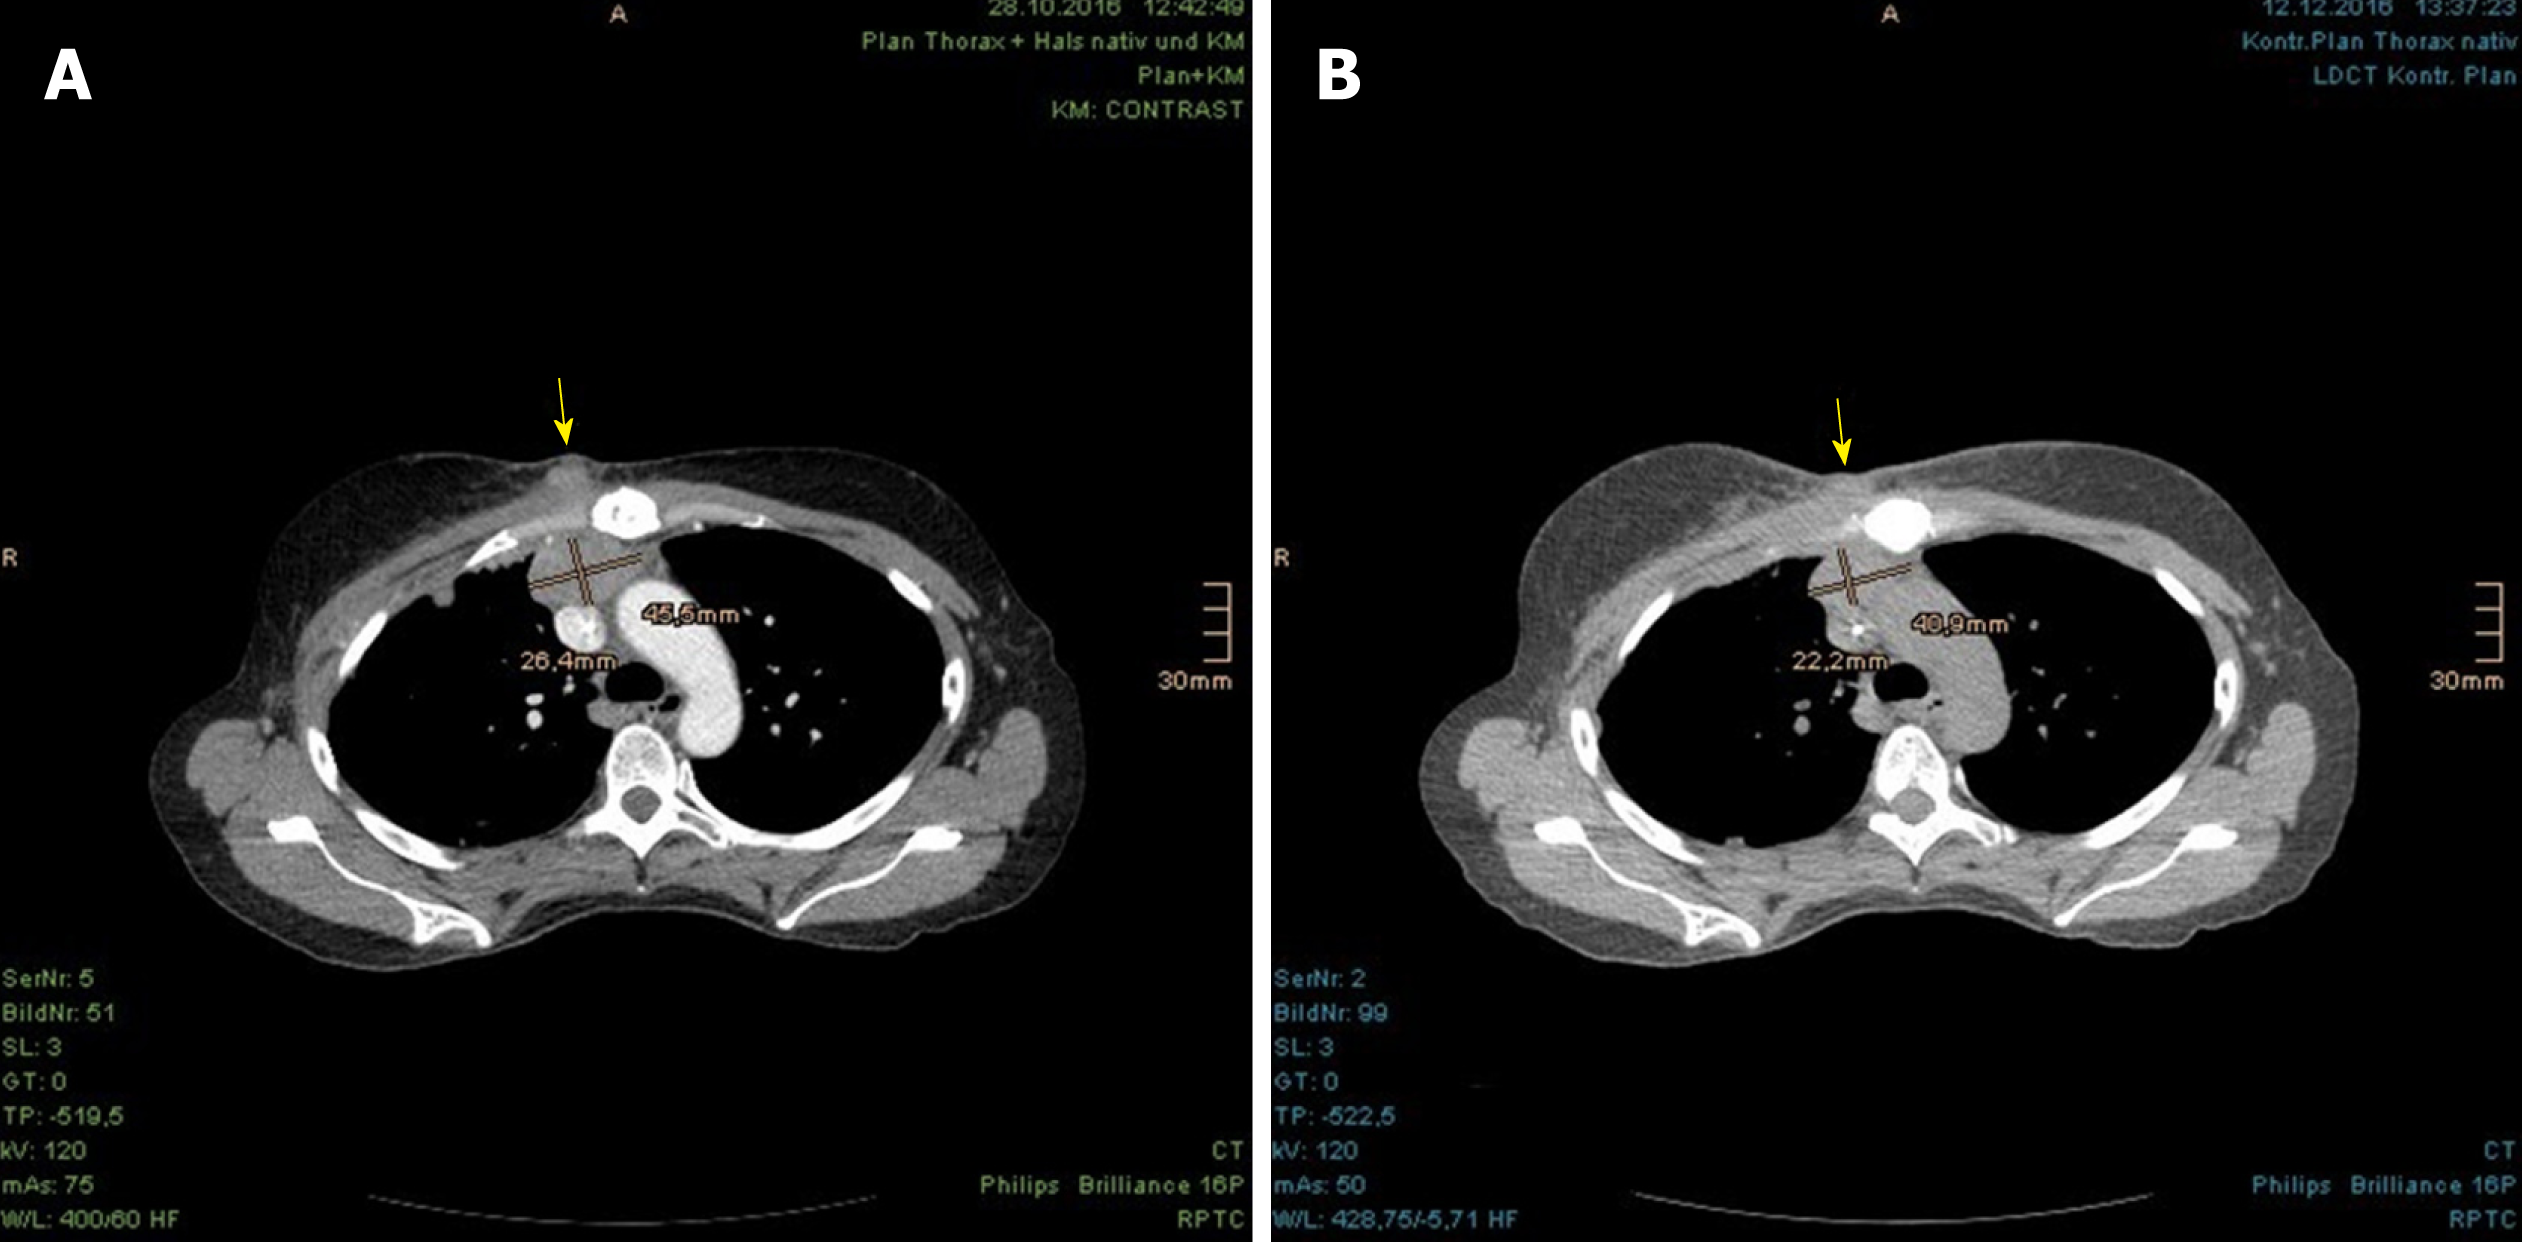
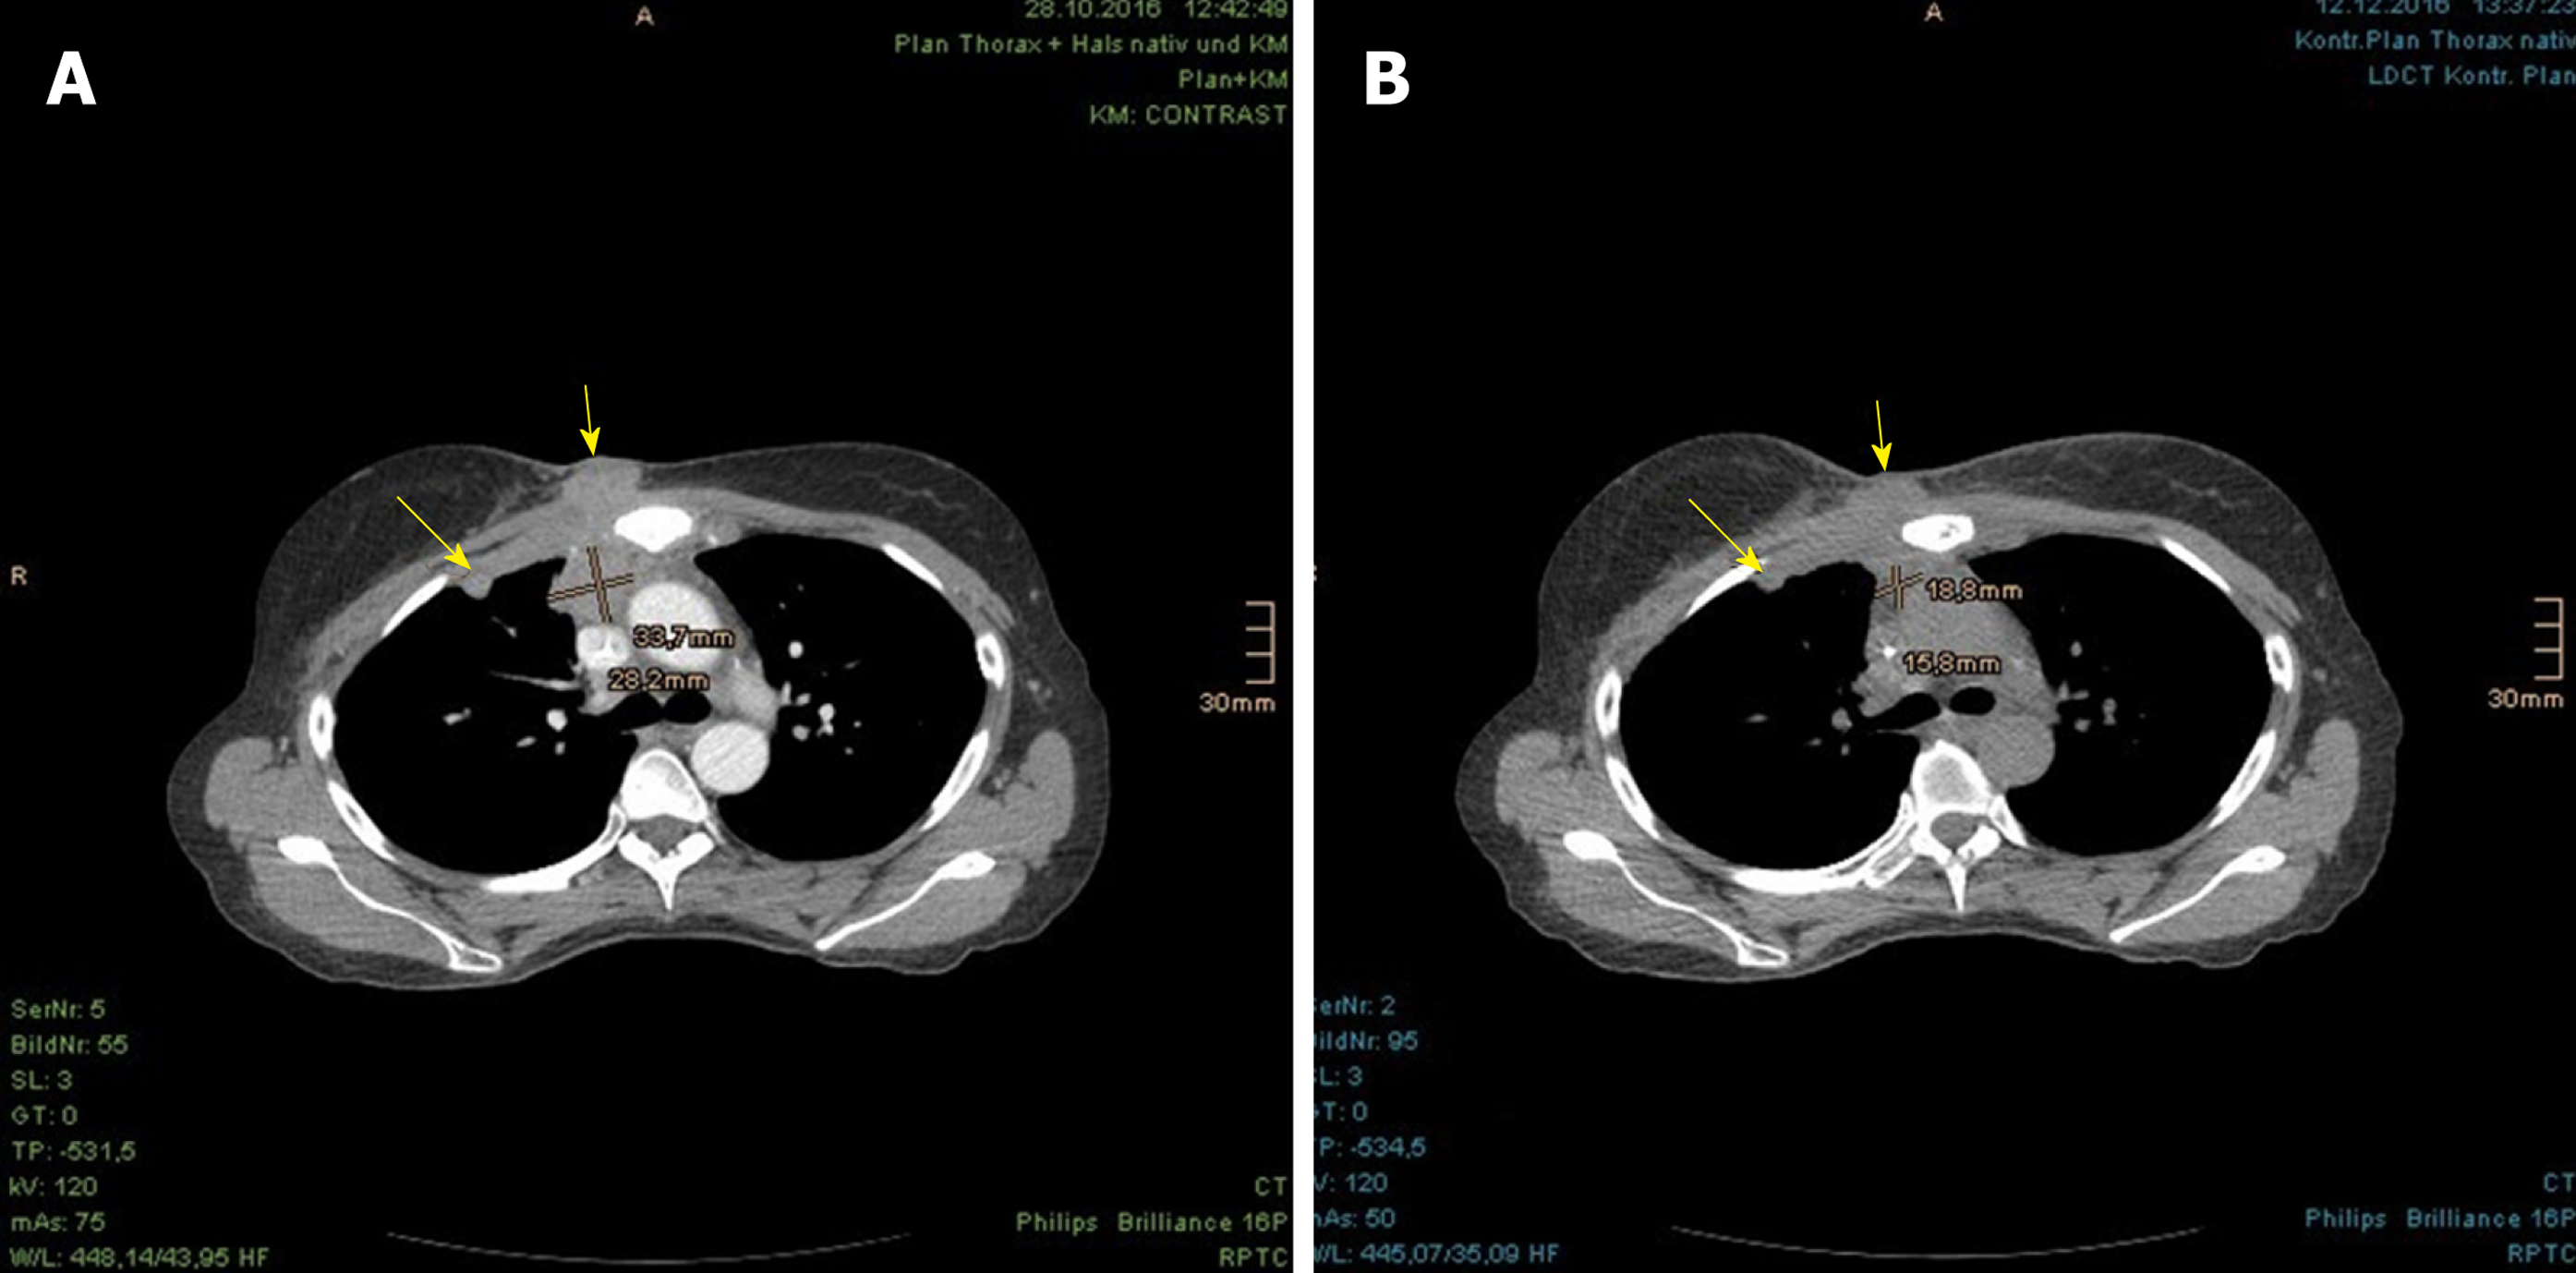
Figure 4 Incipient size reduction of right parasternal metastasis (with size measurement) and chest wall recurrence (marked with arrow) during the proton beam therapy.
A: In planning computed tomography (CT) prior to proton beam therapy; B: In control CT at 26th fraction of treatment.
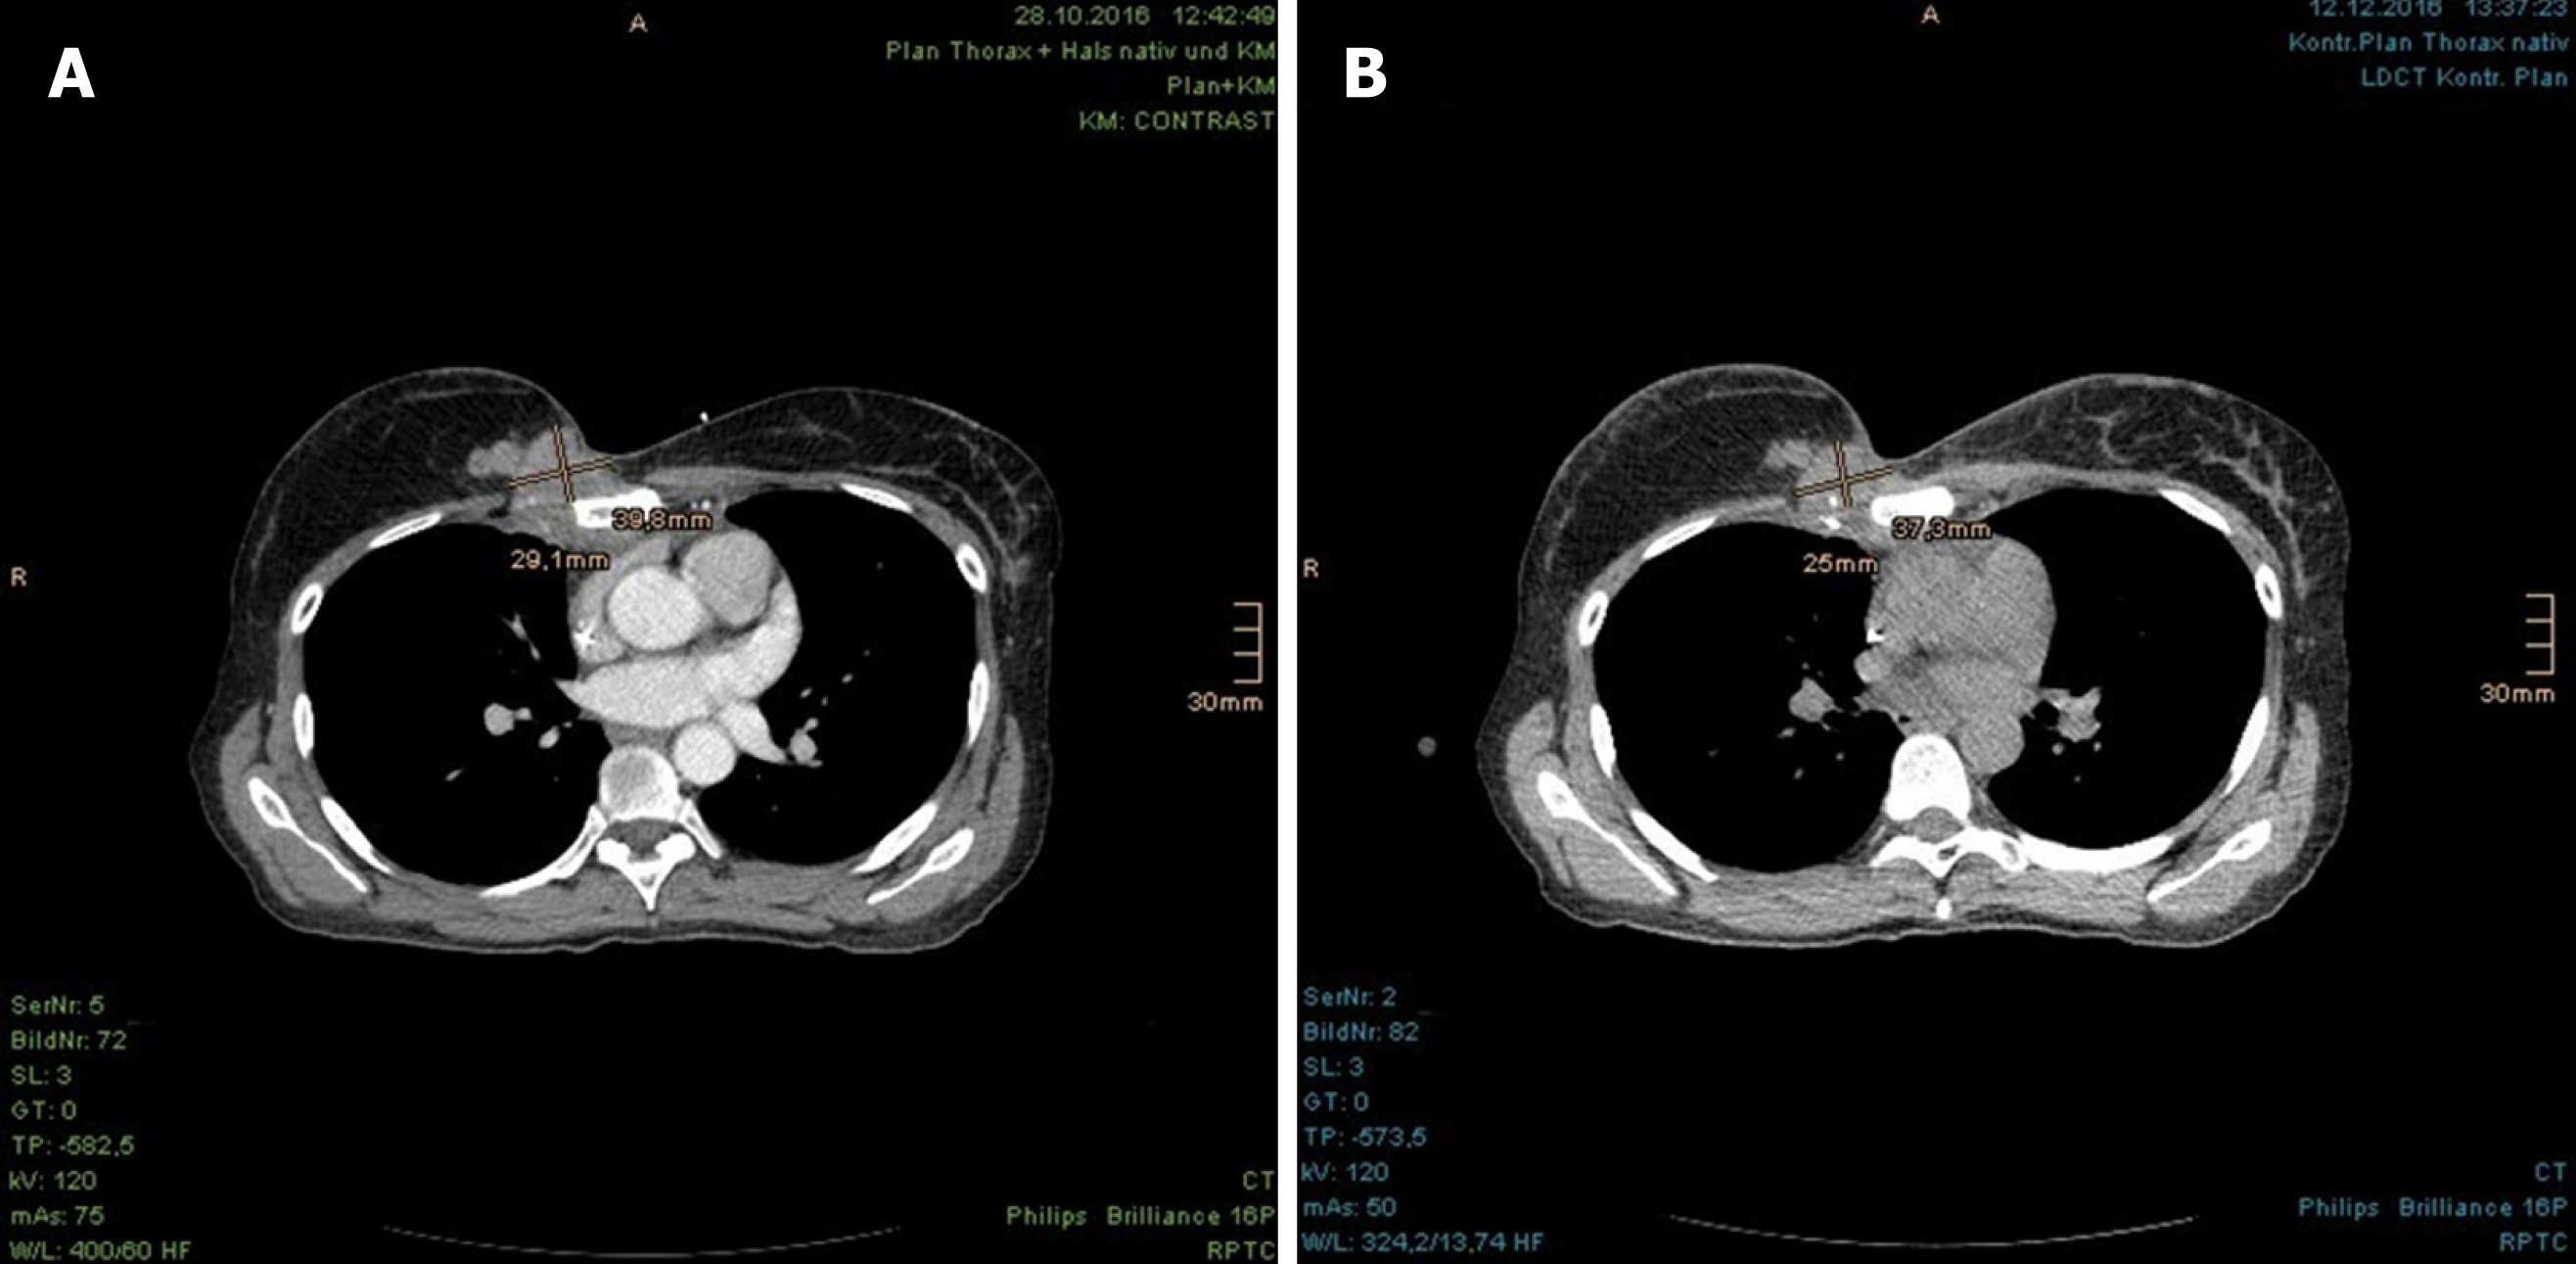
Figure 5 Incipient size reduction of chest wall recurrence (with size measurement) during the proton beam therapy.
A: In planning computed tomography (CT) prior to proton beam therapy; B: In control CT at 26th fraction of treatment.
Figure 6 Incipient size reduction of right parasternal metastasis (with size measurement) as well as chest wall recurrence and pleural metastasis (both marked with arrows) during the proton beam therapy.
A: In planning computed tomography (CT) prior to proton beam therapy; B: In control CT at 26th fraction of treatment.
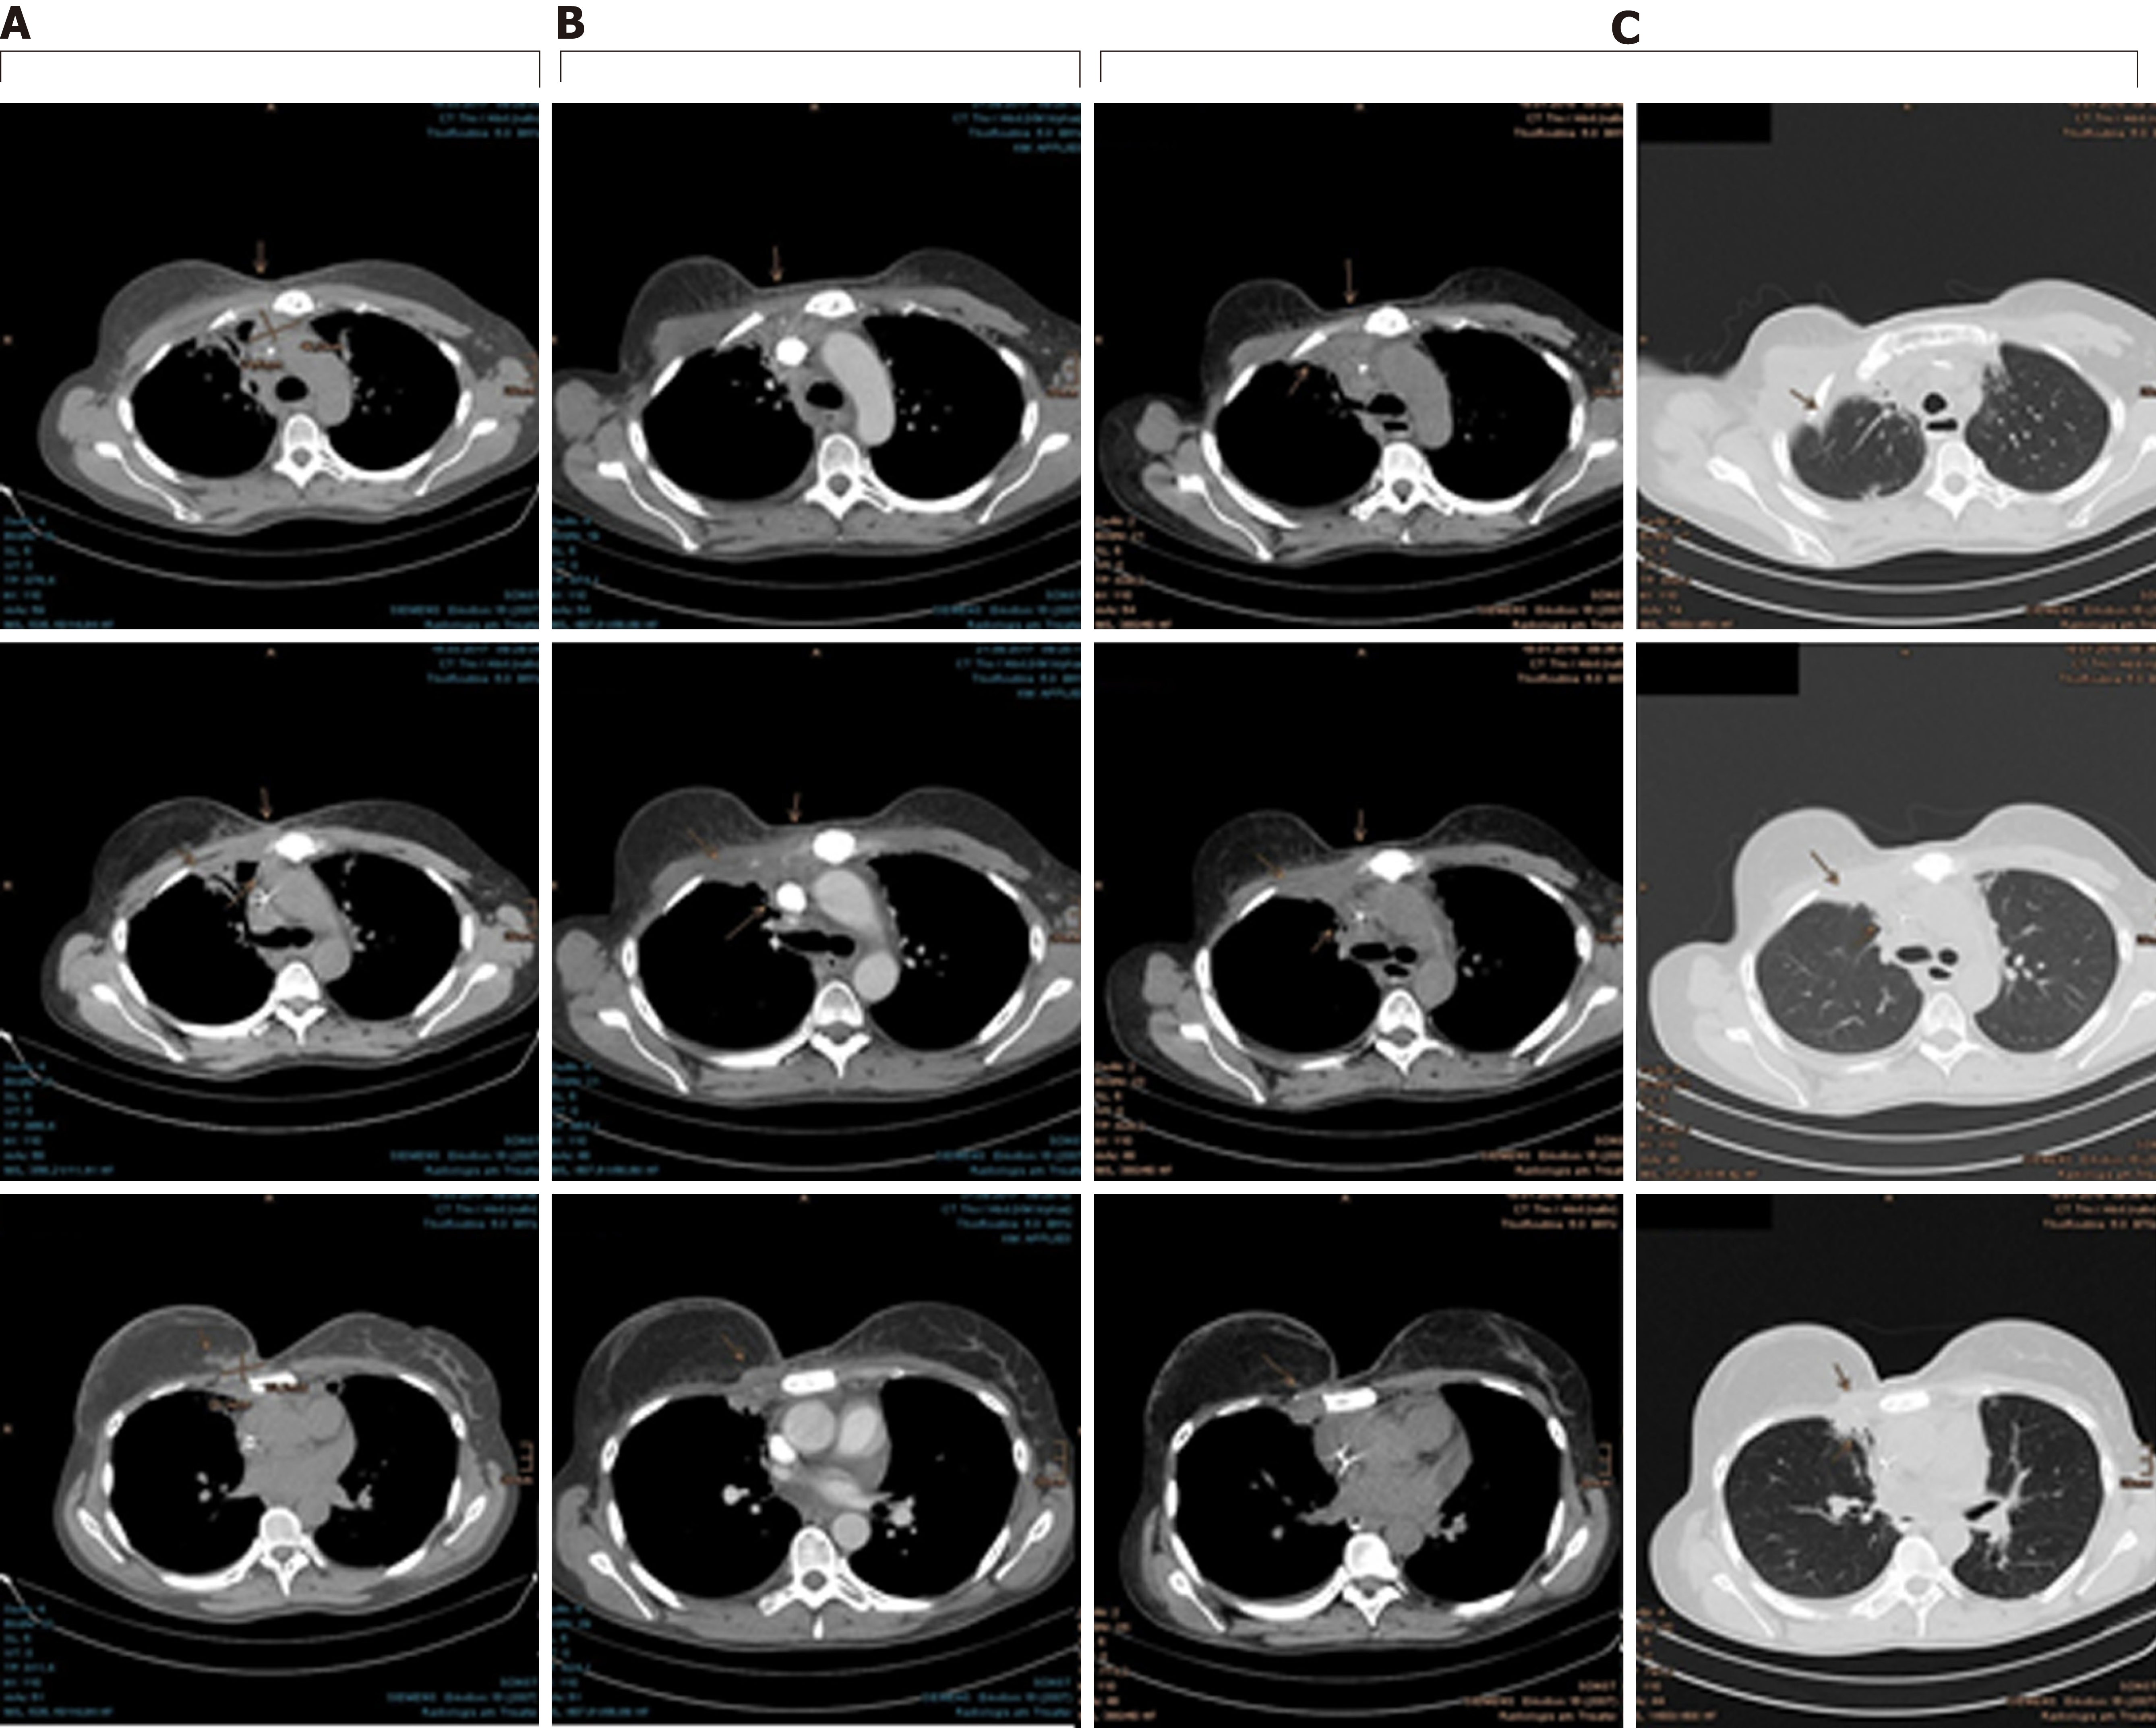
Figure 7 Continuous shrinkage of the chest wall recurrence, right pleural metastases and parasternal lymph node metastases, which are marked with arrows.
A: Follow-up computed tomography (CT) at 3 mo after proton beam therapy; B: Follow-up CT at 9 mo after proton beam therapy; C: Follow-up CT at 13 mo after proton beam therapy.
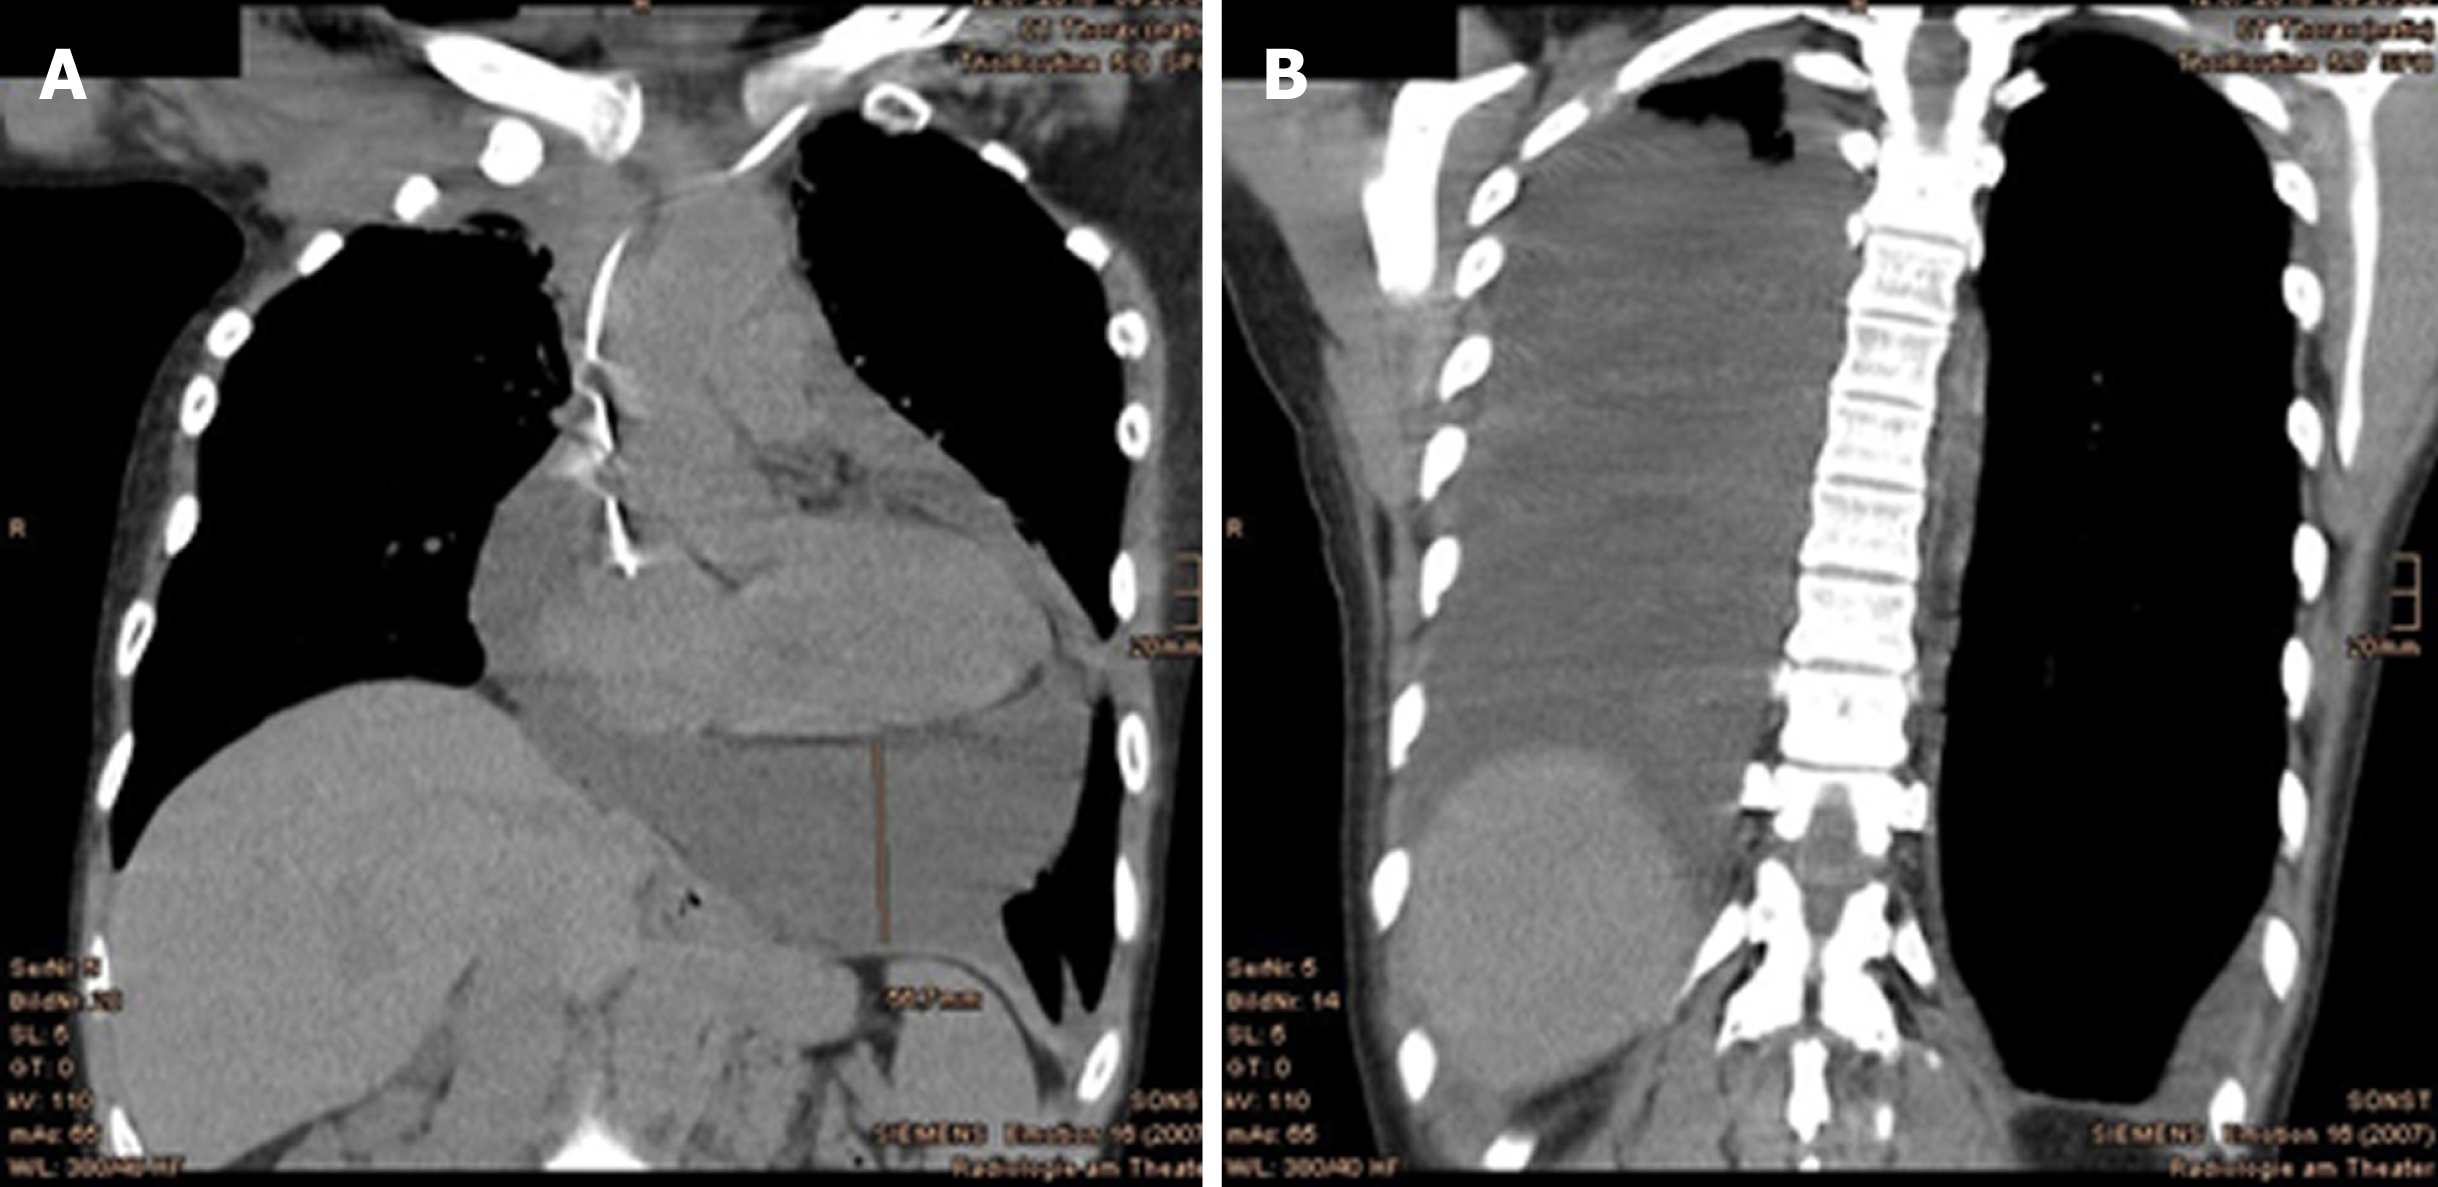
Figure 8 Relevant pericardial and pleural effusions emerged at 19 mo after proton beam therapy.
A: Pericardial effusion; B: Pleural effusion in the coronal plane.
Figure 9 A soft tissue augmentation occurred in the right parasternal area at 19 mo after proton beam therapy.
A: Continuously reduced chest wall recurrence at 13 mo after proton beam therapy; B: Discreet augmentation of right parasternal soft tissue and significant pleural effusion on the right at 19 mo after proton beam therapy; C: Consistent size of right parasternal soft tissue and decrease of pleural effusion at 22 mo after proton beam therapy. The tumor is marked with arrows.
Figure 10 Follow-up computed tomography at 22 mo after proton beam therapy showed significantly improved findings of (A) pleural effusions and (B) pericardial effusions.
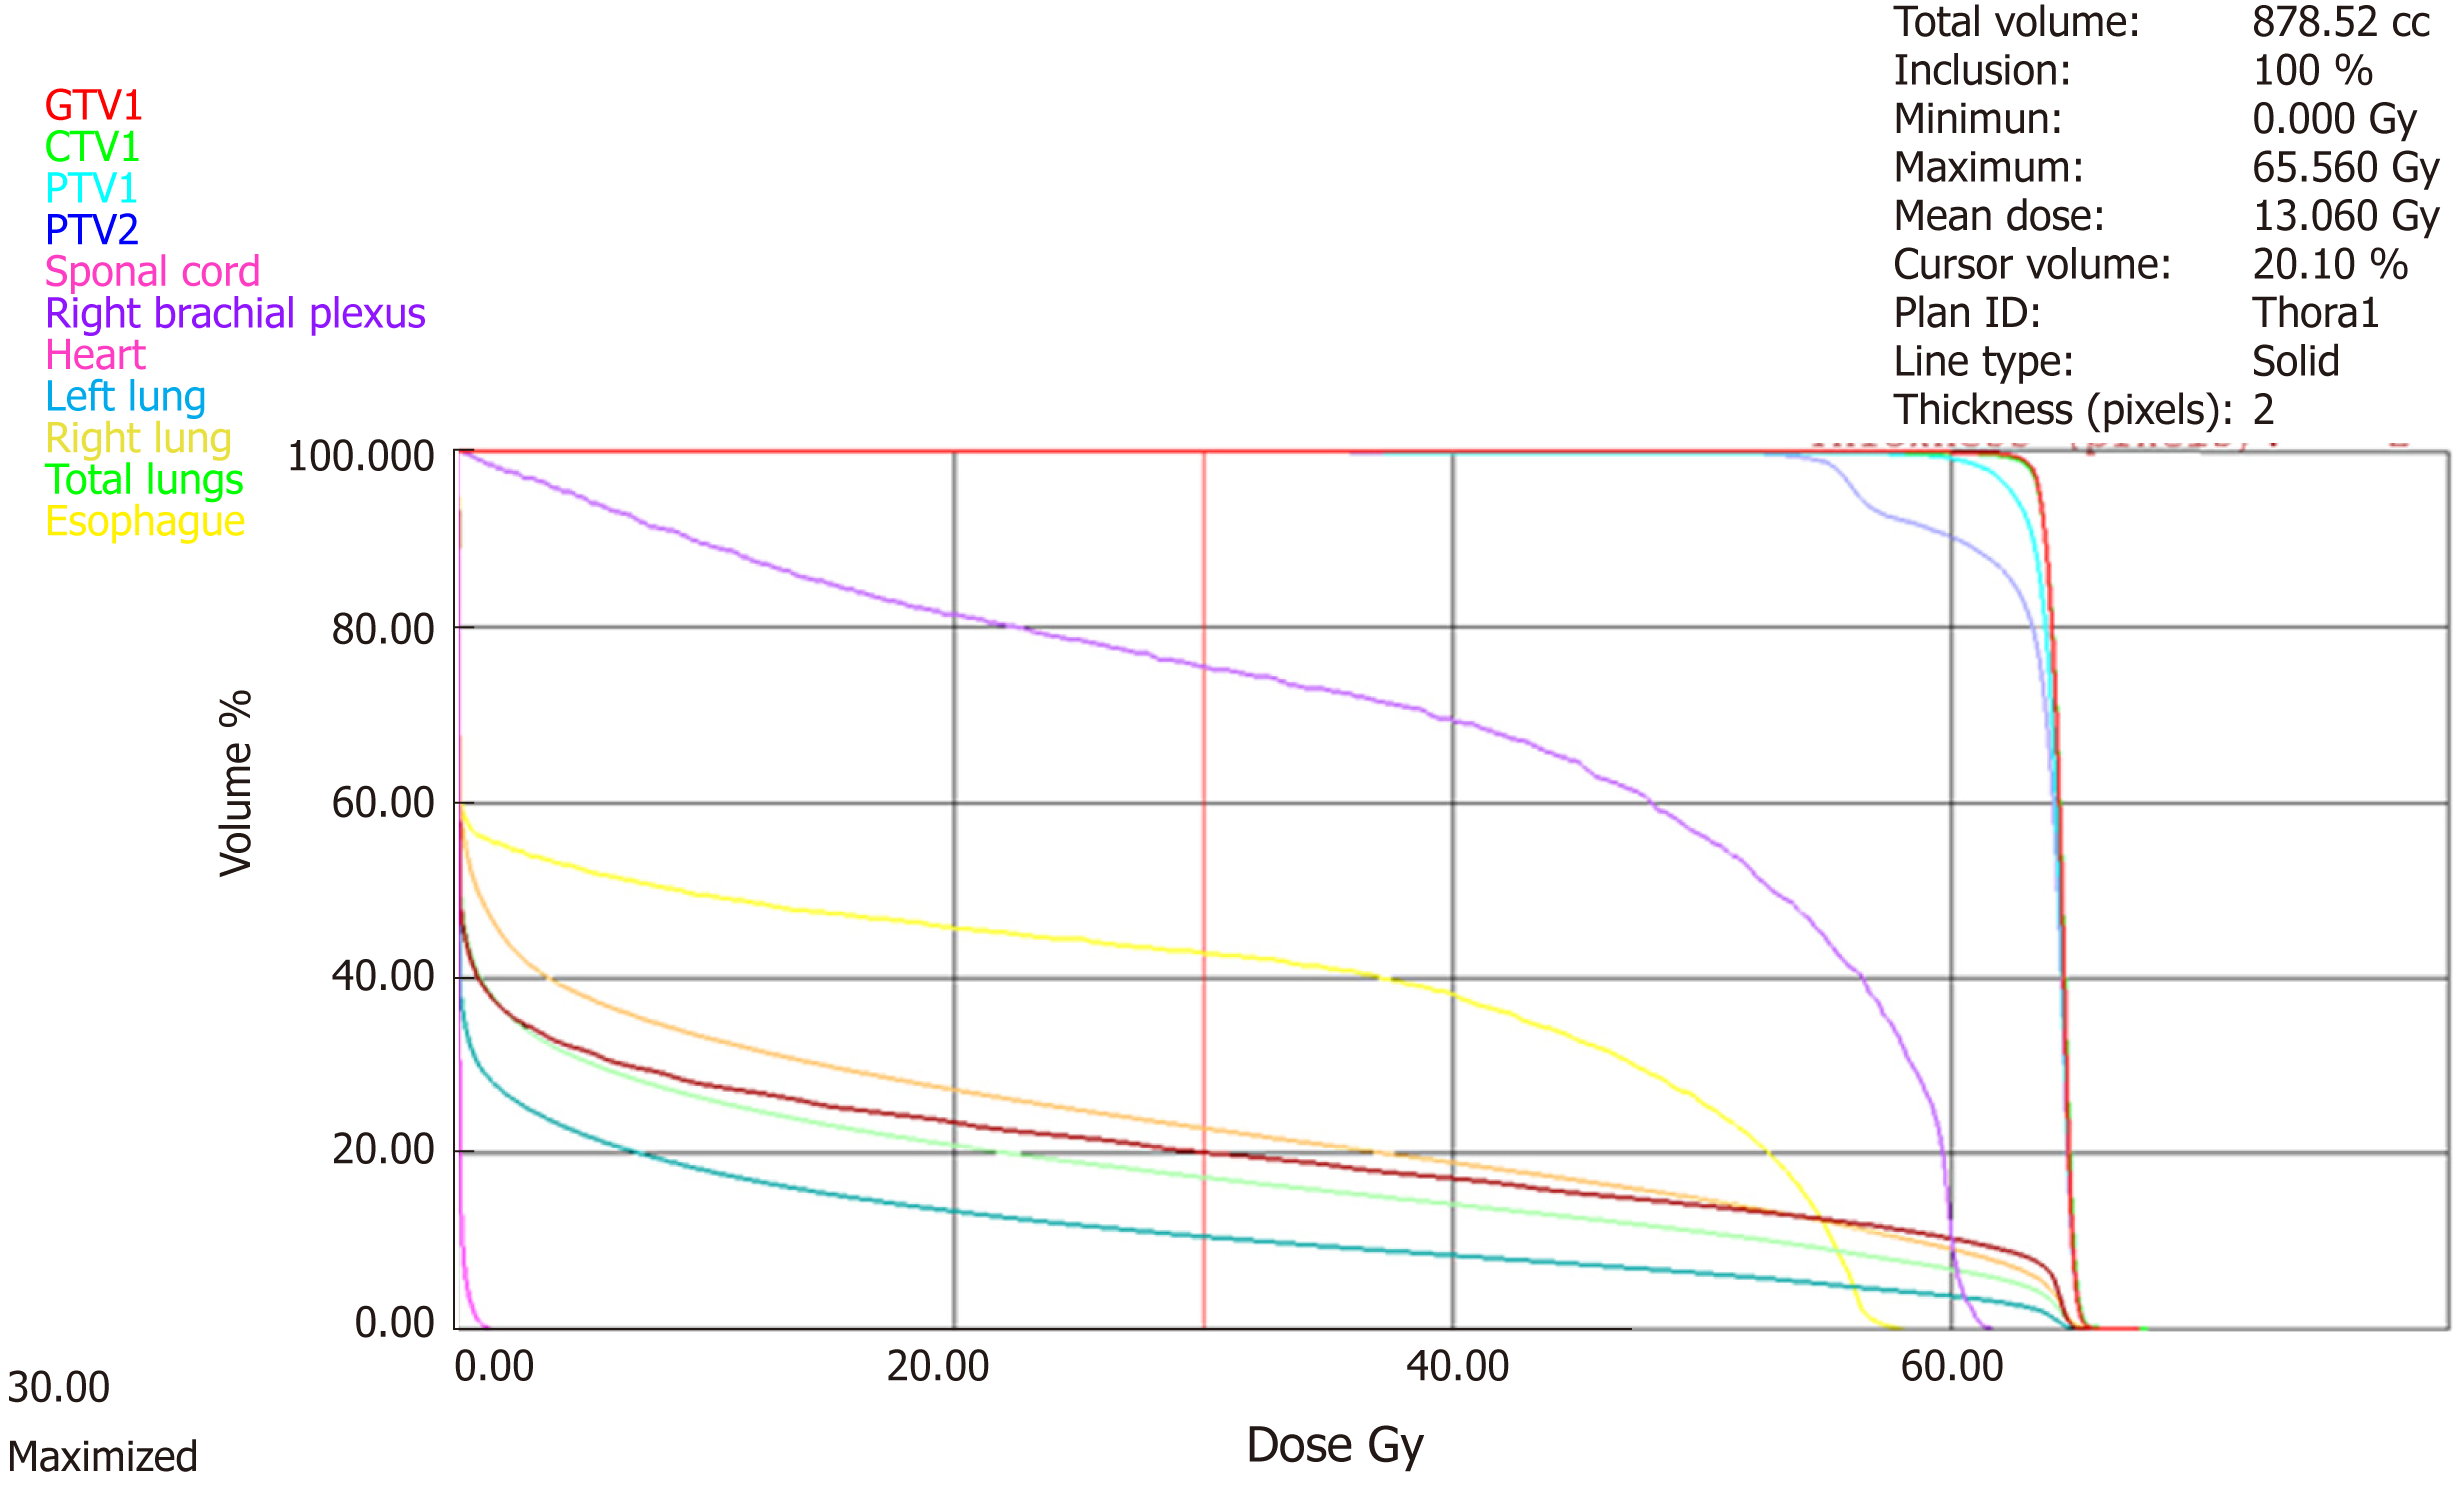
Figure 11 Dose-volume-histogram of the target volumes and organs at risk.
- Citation: Lin YL. Reirradiation of recurrent breast cancer with proton beam therapy: A case report and literature review. World J Clin Oncol 2019; 10(7): 256-268
- URL: https://www.wjgnet.com/2218-4333/full/v10/i7/256.htm
- DOI: https://dx.doi.org/10.5306/wjco.v10.i7.256


