Copyright
©The Author(s) 2019.
World J Clin Oncol. Jul 24, 2019; 10(7): 256-268
Published online Jul 24, 2019. doi: 10.5306/wjco.v10.i7.256
Published online Jul 24, 2019. doi: 10.5306/wjco.v10.i7.256
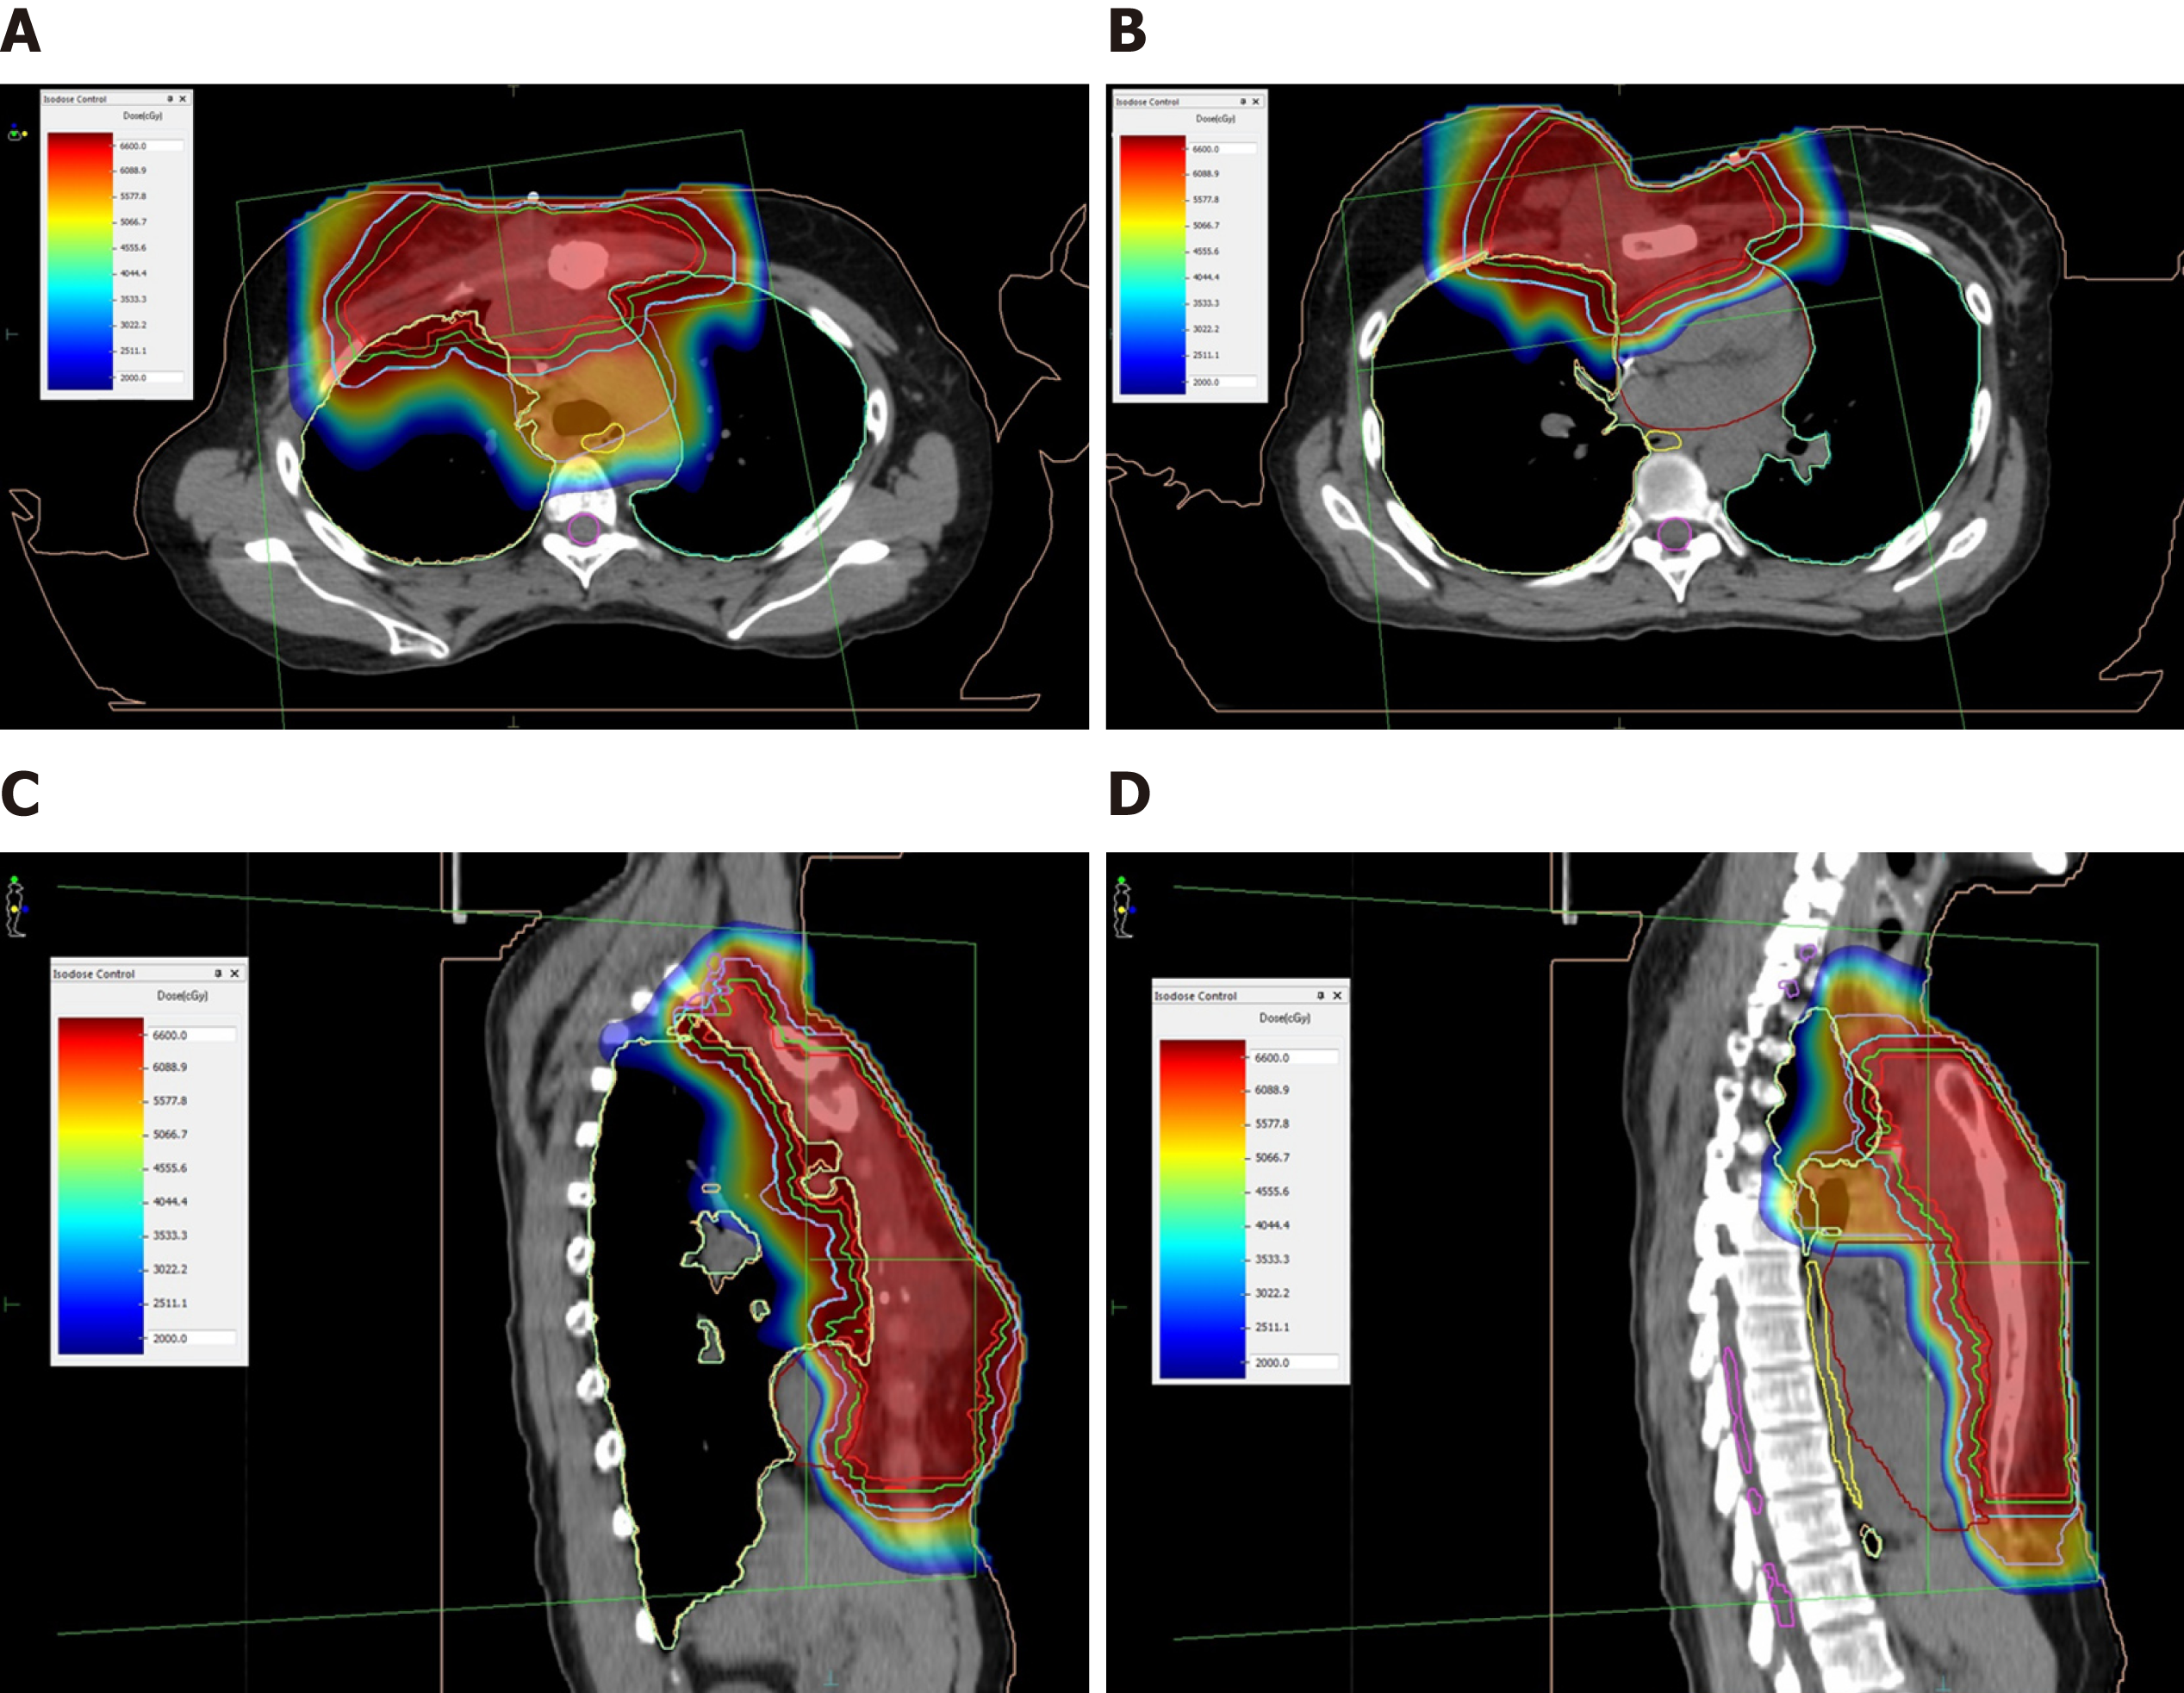
Figure 3 Treatment plan of proton beam therapy with isodose distributions.
A and B: Axial plane; C and D: Sagittal plane. Red line: Gross tumor volume; Green line: Clinical target volume; Blue line: Planning target volume of gross tumors; Lilac line: Planning target volume of gross tumors including adjacent regional lymphatics and sternum.
- Citation: Lin YL. Reirradiation of recurrent breast cancer with proton beam therapy: A case report and literature review. World J Clin Oncol 2019; 10(7): 256-268
- URL: https://www.wjgnet.com/2218-4333/full/v10/i7/256.htm
- DOI: https://dx.doi.org/10.5306/wjco.v10.i7.256


