Copyright
©2010 Baishideng Publishing Group Co.
World J Clin Oncol. Nov 10, 2010; 1(1): 3-11
Published online Nov 10, 2010. doi: 10.5306/wjco.v1.i1.3
Published online Nov 10, 2010. doi: 10.5306/wjco.v1.i1.3
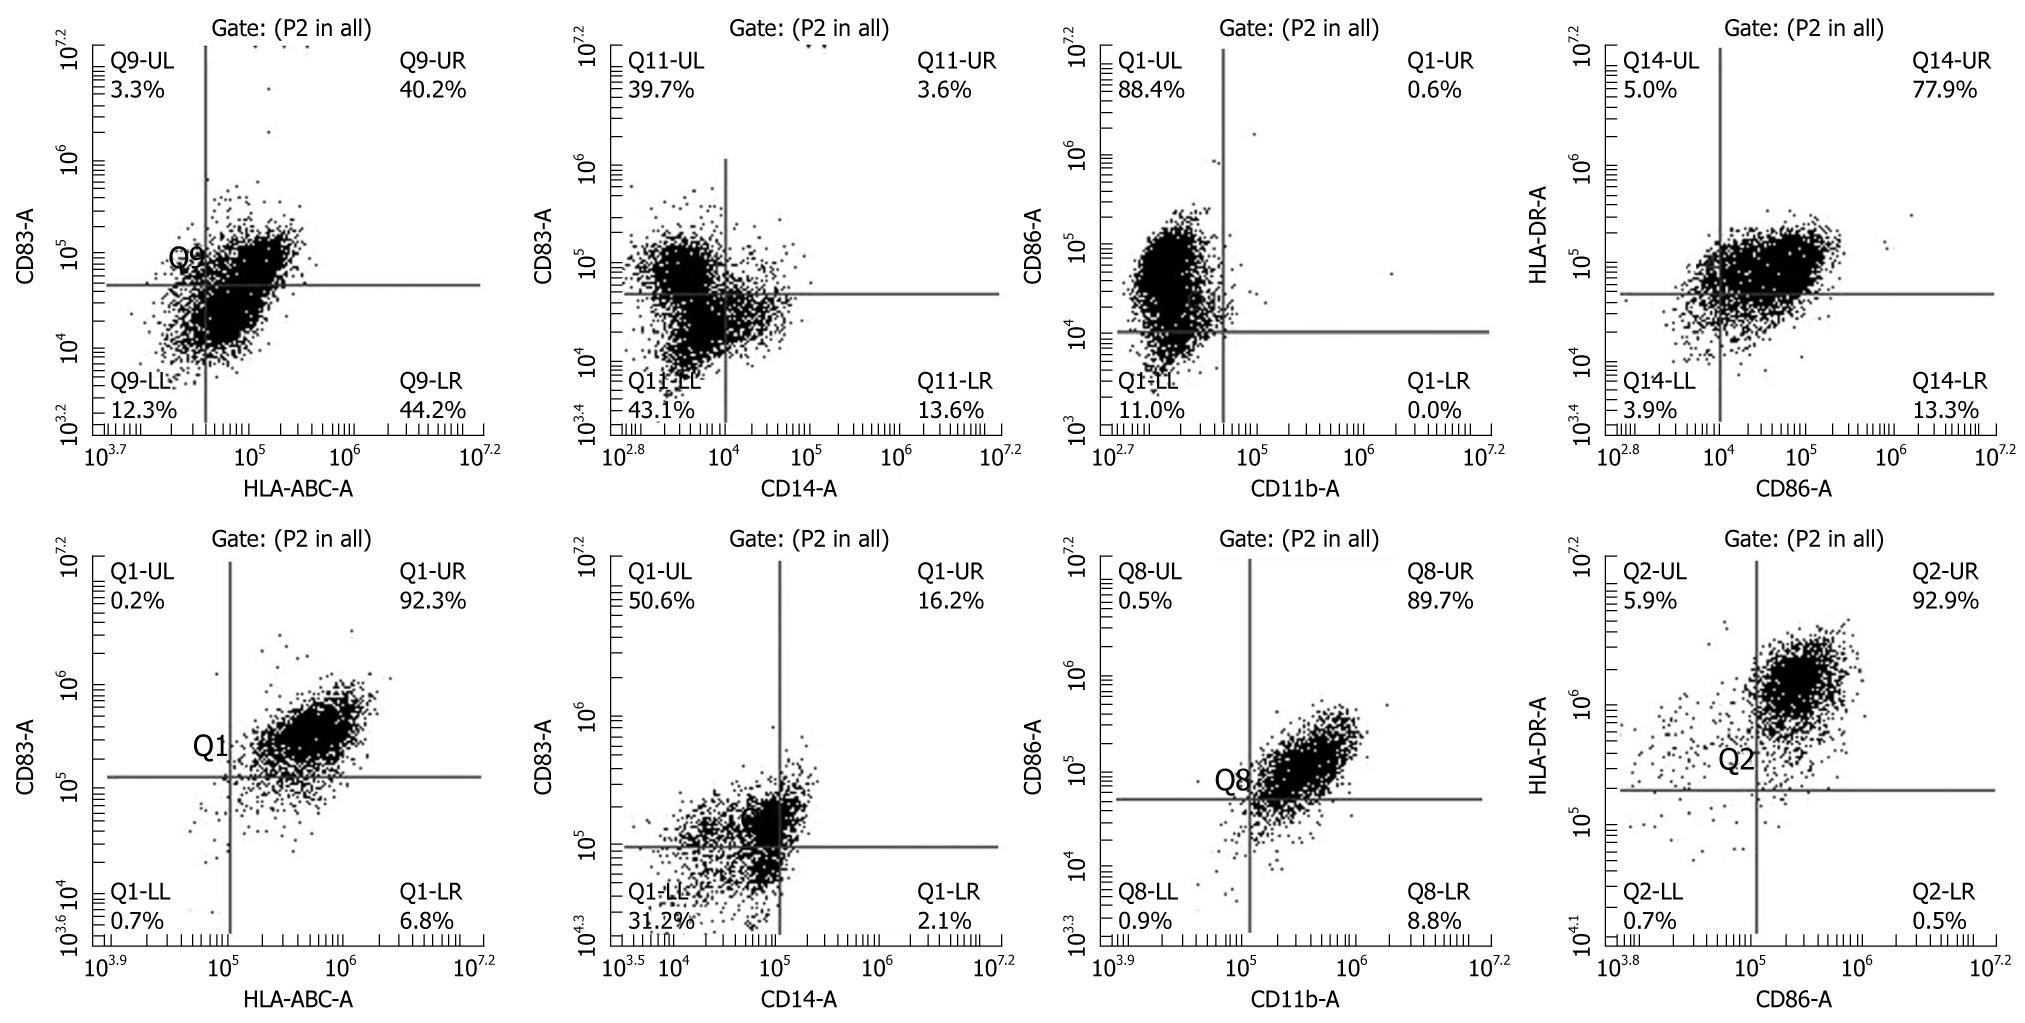
Figure 1 Phenotypic analysis of immature (upper panel) and mature dendritic cells (lower panel).
CD14+ cells collected from cord blood were incubated in immature dendritic cell (DC) media (RPMI-1640 plus 10% FBS) containing granulocyte colony stimulating factor (G-SCF) and IL-4 for 8 d and then cells were incubated with tumor necrosis factor (TNF)-α in addition to G-CSF and IL-4. Cells show typical monocytic DC markers (low CD14, high HLA-ABC, HLA-DR, CD86, CD83 and CD11b). Note the increase in the population of CD83 positive cells, a marker of mature DCs, after addition of TNF-α.
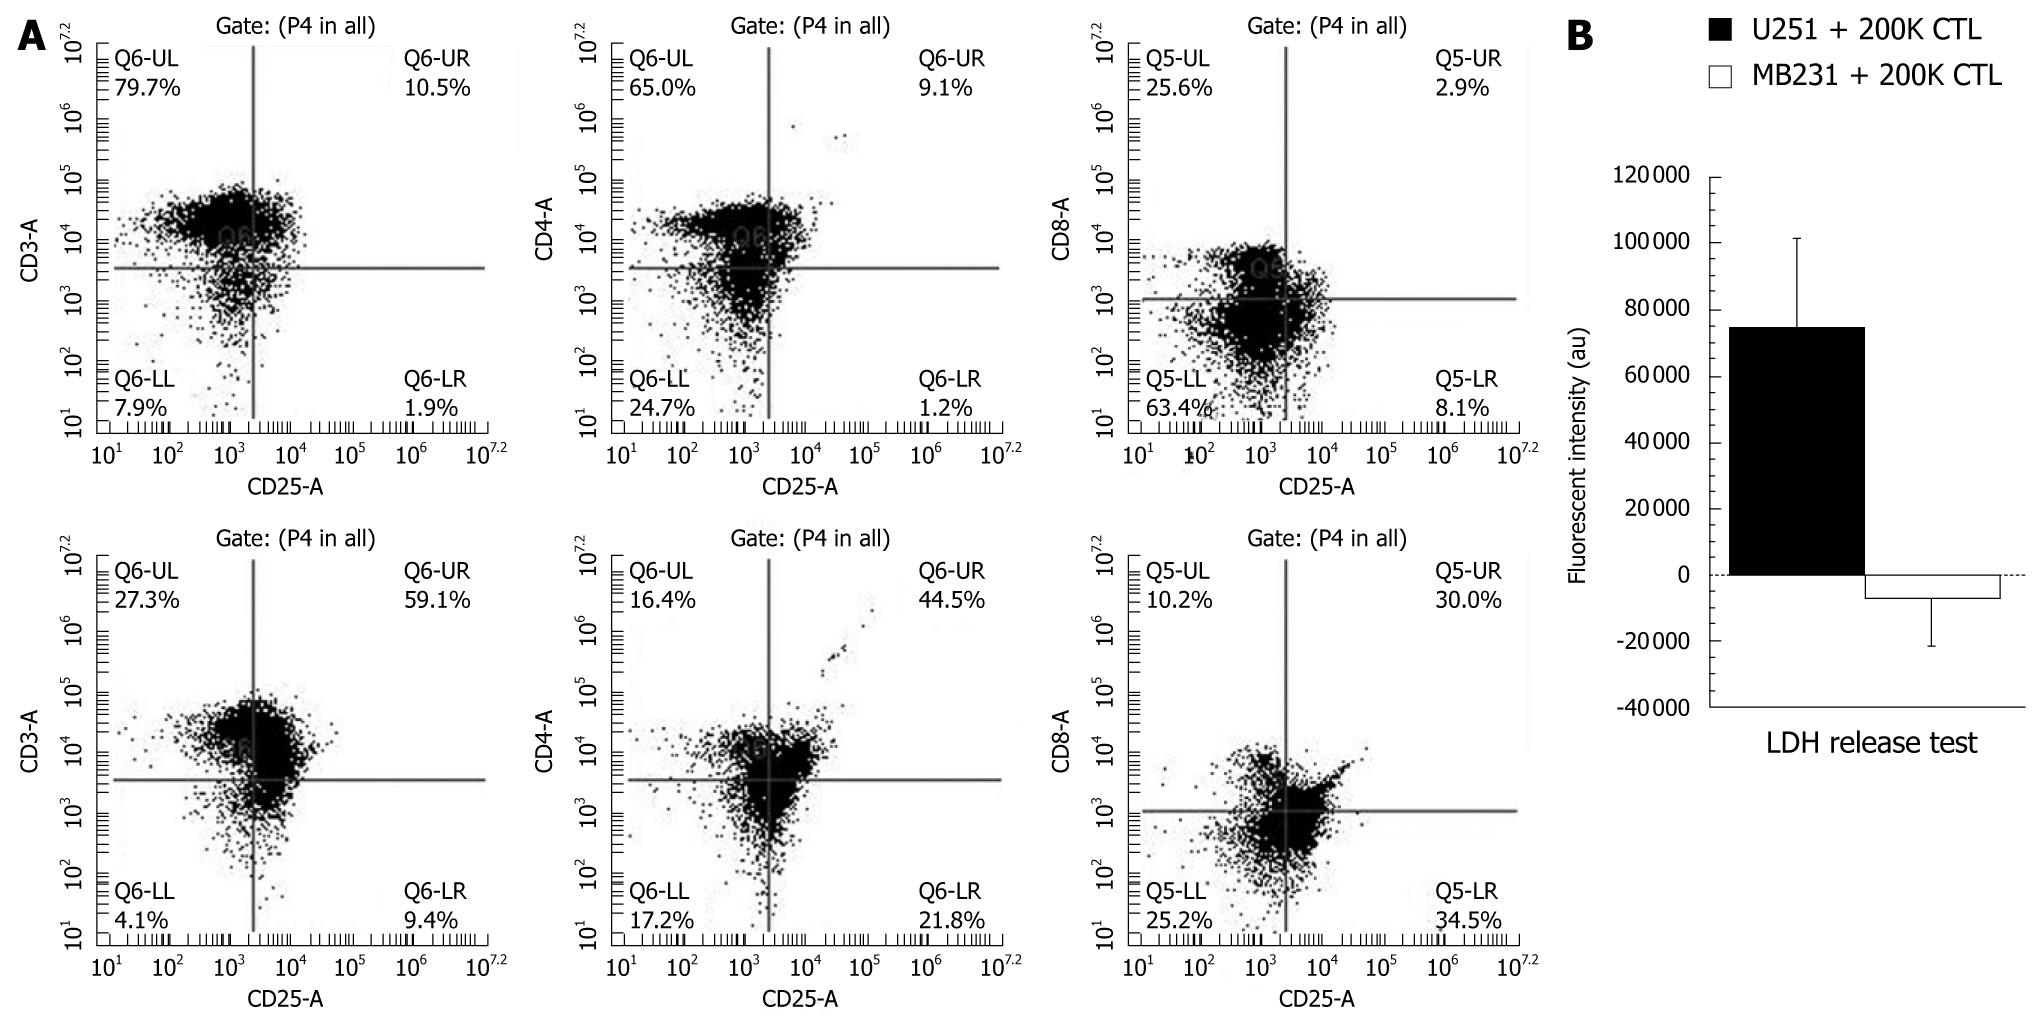
Figure 2 Phenotypic analyses of sensitized T-cells (cytotoxic T-cells) and cytotoxic activity of produced cytotoxic T-cells.
A: Analysis of T-cell markers. Phenotypic analysis of control T-cells (upper panel) and T-cells co-incubated with tumor lysate-pulsed irradiated mature dendritic cells (DCs) for 4 d (lower panel). Note the increased number of CD25+ cells (activated T-cells) after sensitizing them with DCs; B: To determine the cytotoxic specificity of the produced cytotoxic T-cells (CTLs) to U251 cells, 200 000 (200K) CTLs (sensitized to U251 cell lysate) were co-cultured overnight with U251 (100 000 cells) or human breast cancer cells (MBA-MD-231, 100 000) and the released lactate dehydrogenase (LDH) was determined by a commercially available membrane integrity assay kit (Cyto Tox-ONE, Promega Corp, WI, USA). LDH levels indicate cytotoxicity since LDH is released to the media once cell membranes are damaged. Note the significantly (P≤ 0.05) increased LDH release from U251 cells indicating the specificity of produced CTLs.
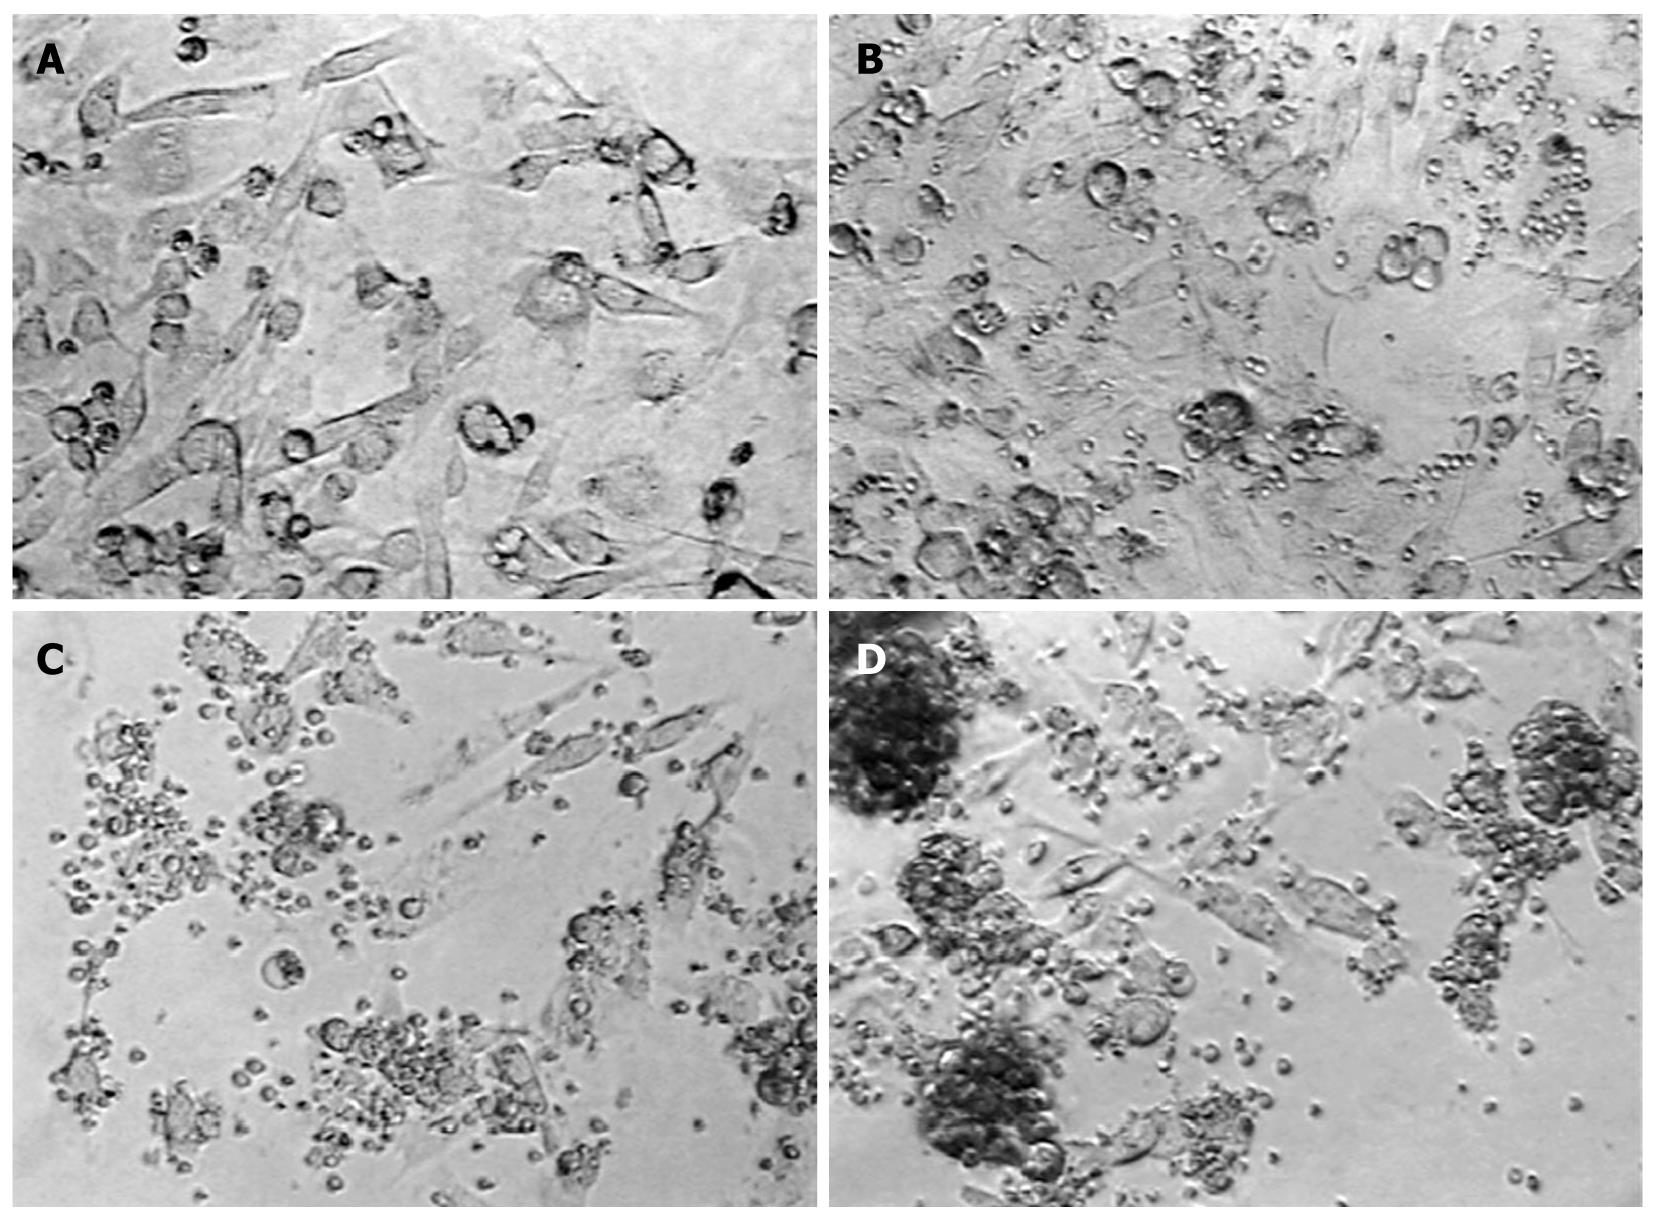
Figure 3 The interaction of cytotoxic T-cells (labeled and unlabeled) with U251 glioma cells.
Cytotoxic T-cells (CTLs) were produced using U251 cell lysate-pulsed irradiated mature dendritic cells. A: Normal U251 cells; B: Control T-cells; C:Unlabeled CTLs targeting U251 cells; D:Labeled CTL U251 cells,ferumoxide-protamine sulfate (FePro) labeled CLTs were co-incubated with U251 overnight.
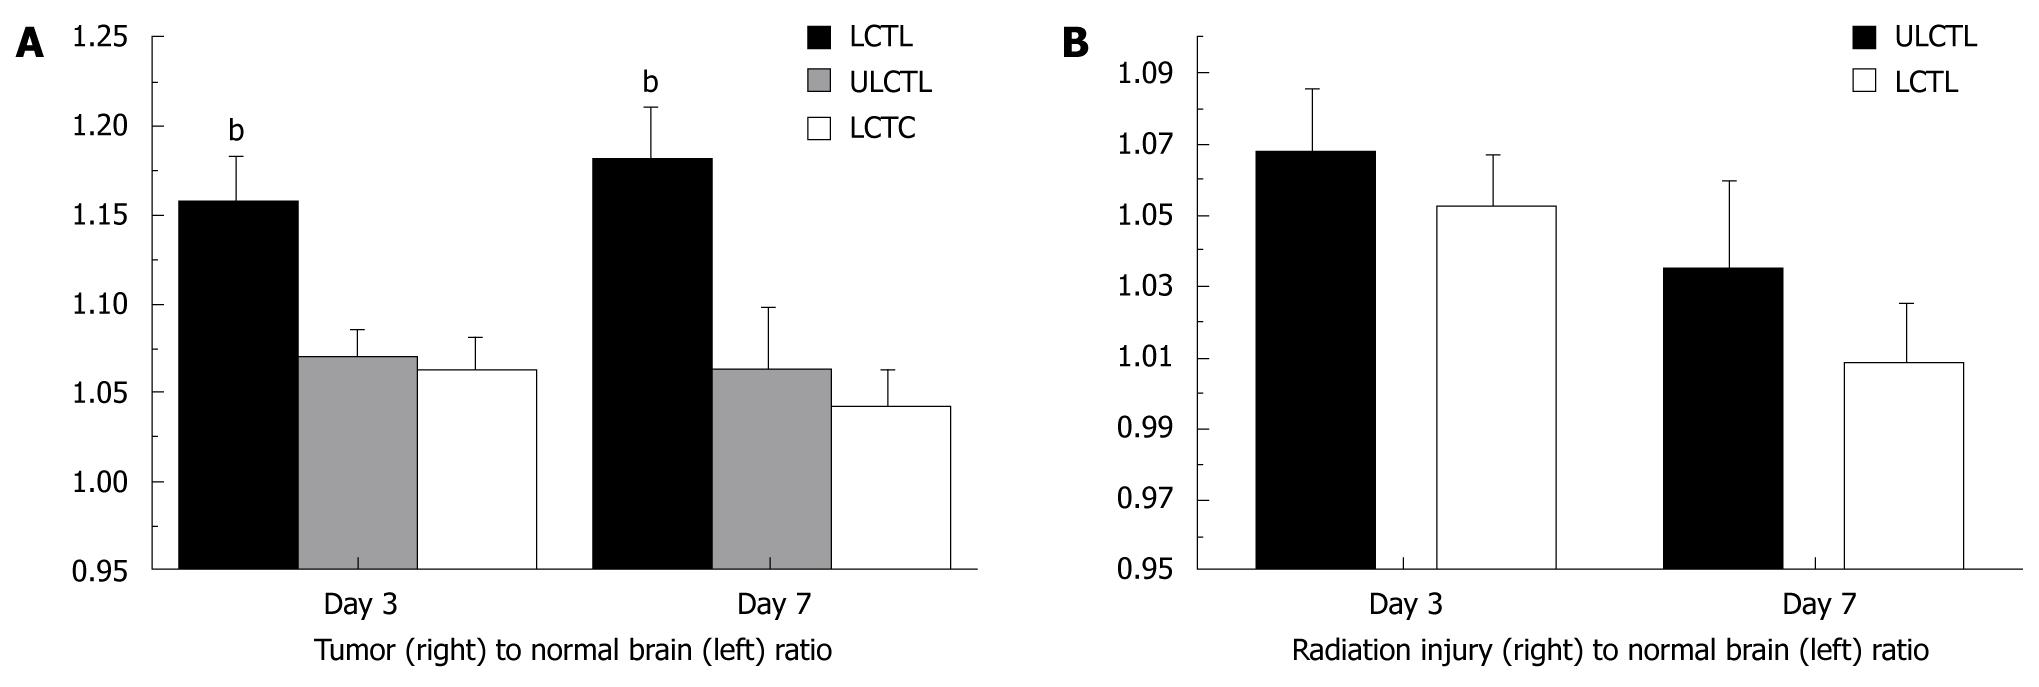
Figure 4 Accumulation of labeled cytotoxic T-cells in implanted U251 tumor and radiation injured sites in rat brain.
A: Analyses of R2* values normalized to contralateral normal hemisphere (indirect indicator of the accumulation of iron positive cells) showed significantly higher (bP≤ 0.001) accumulation of iron positive cells in tumor that received labeled cytotoxic T-cells (LCTL) compared to that of labeled control T-cells (LCTC) and unlabeled CTLs (ULCTL). The number of accumulated cells was higher at both day 3 and 7; B: Similar analyses of R2* values in radiation injured brain normalized to contralateral normal hemisphere showed no difference between the groups of animals that received labeled and unlabeled CTLs.
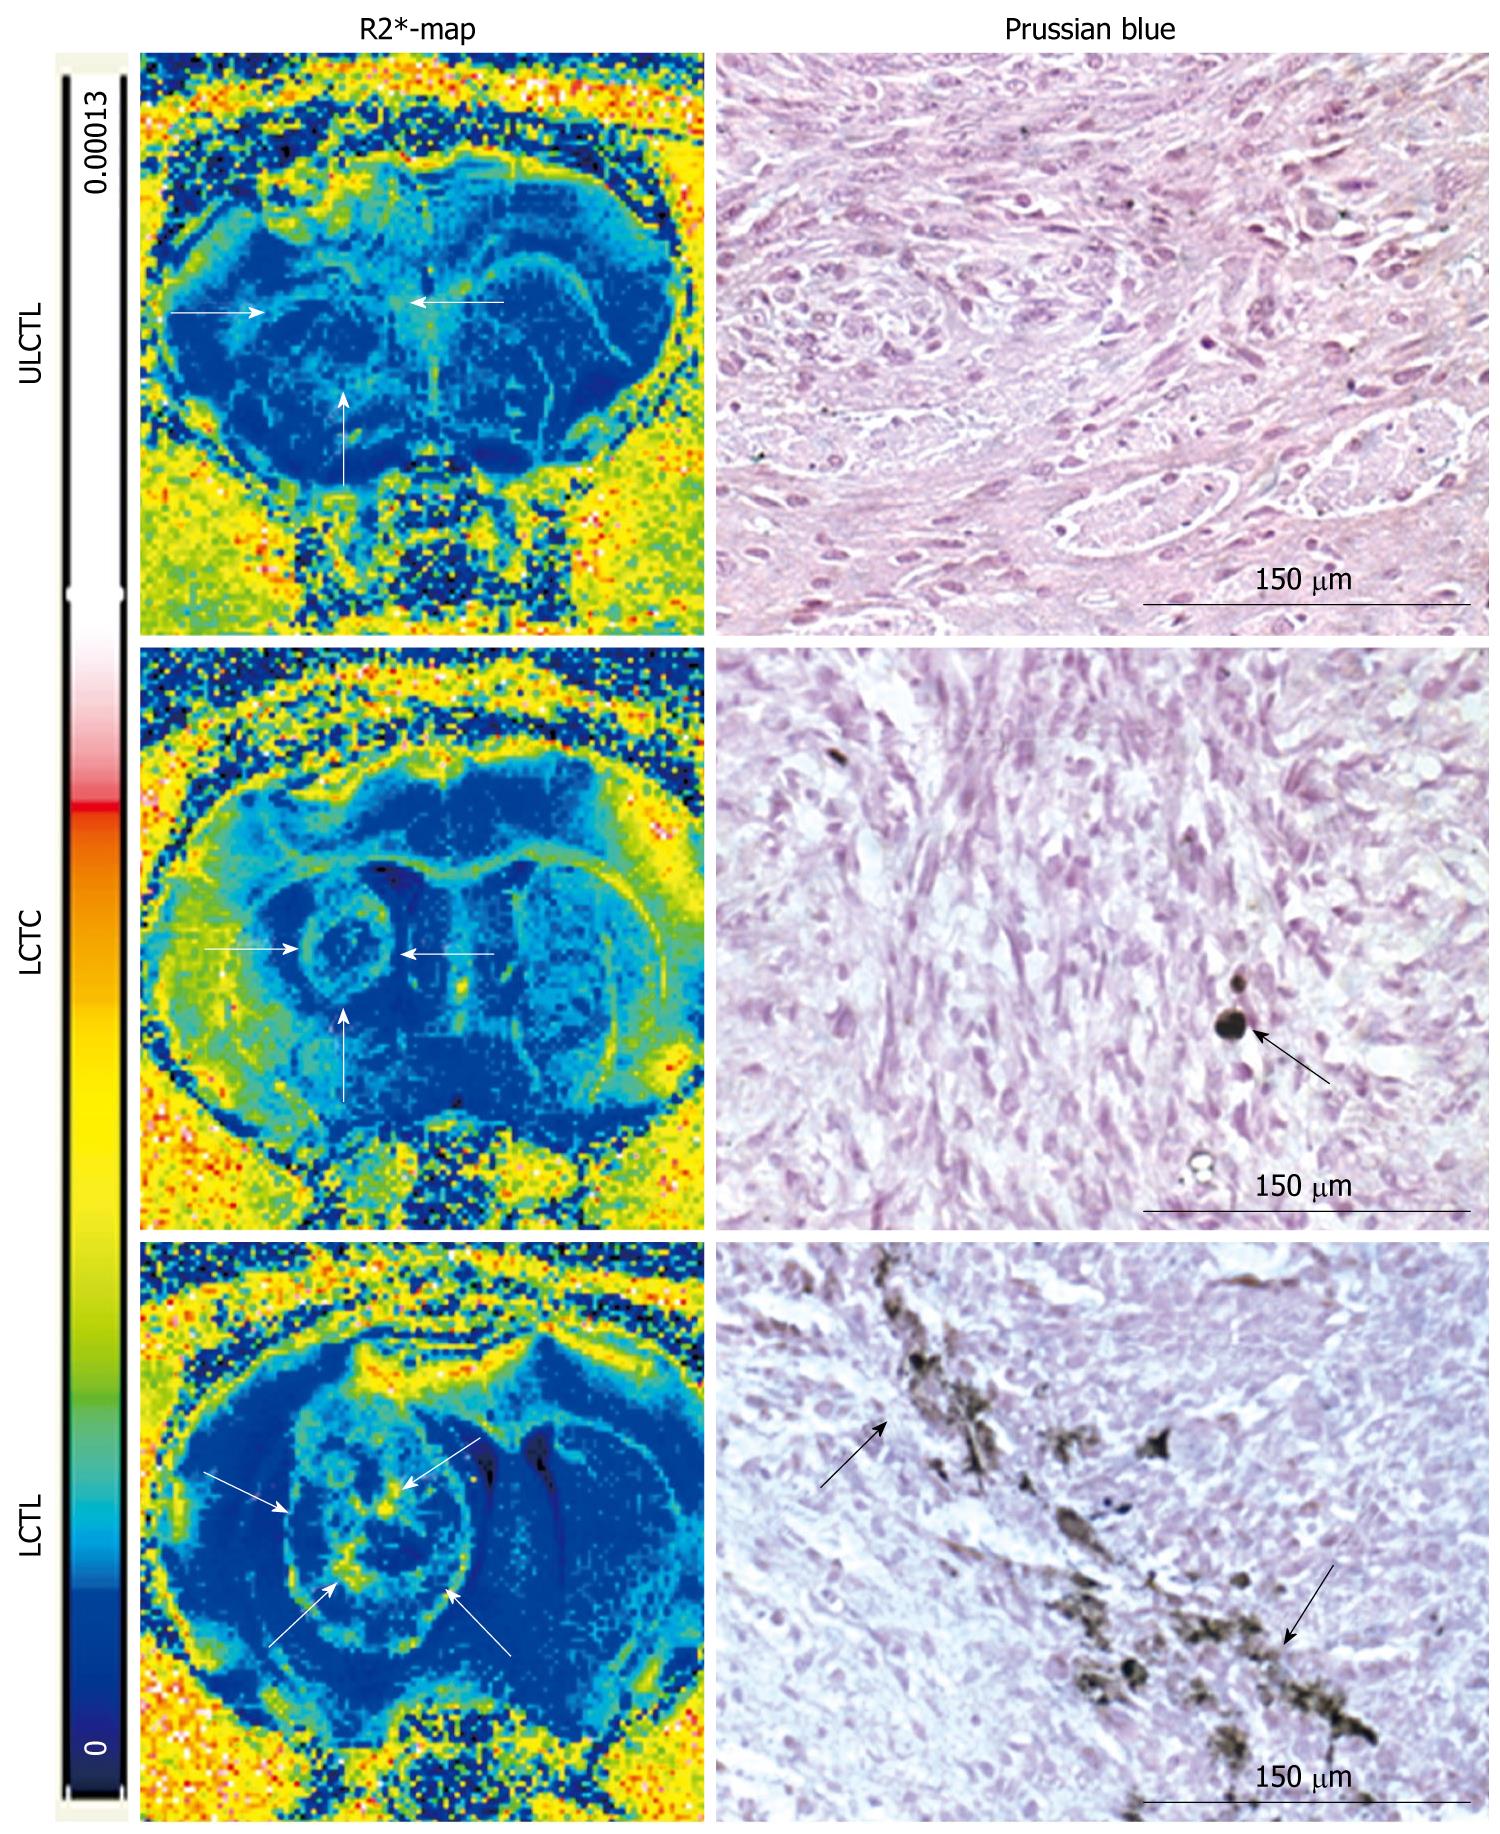
Figure 5 Magnetic resonance imaging relaxivity maps and Prussian blue staining.
R2* maps and DAB enhanced Prussian blue staining from representative animals that received unlabeled cytotoxic T-cells (CTLs) (ULCTL, upper row), labeled control T-cells (LCTC, middle row) and labeled CTLs (LCTL, lower row). R2* maps show high signal intensity areas only in tumors that received LCTC and LCTL. Animals that received LCTL show high signal intensity areas both at the peripheral and central part of the tumors (arrows). Corresponding DAB enhanced Prussian blue staining show multiple Prussian blue positive cells in tumors that received LCTL (arrows). There are a few Prussian blue positive cells seen in tumors that received LCTC (arrow). No definite Prussian blue positive cells were seen in tumors that received ULCTL.
- Citation: Arbab AS. Cytotoxic T-cells as imaging probes for detecting glioma. World J Clin Oncol 2010; 1(1): 3-11
- URL: https://www.wjgnet.com/2218-4333/full/v1/i1/3.htm
- DOI: https://dx.doi.org/10.5306/wjco.v1.i1.3


