Copyright
©2010 Baishideng Publishing Group Co.
World J Clin Oncol. Nov 10, 2010; 1(1): 3-11
Published online Nov 10, 2010. doi: 10.5306/wjco.v1.i1.3
Published online Nov 10, 2010. doi: 10.5306/wjco.v1.i1.3
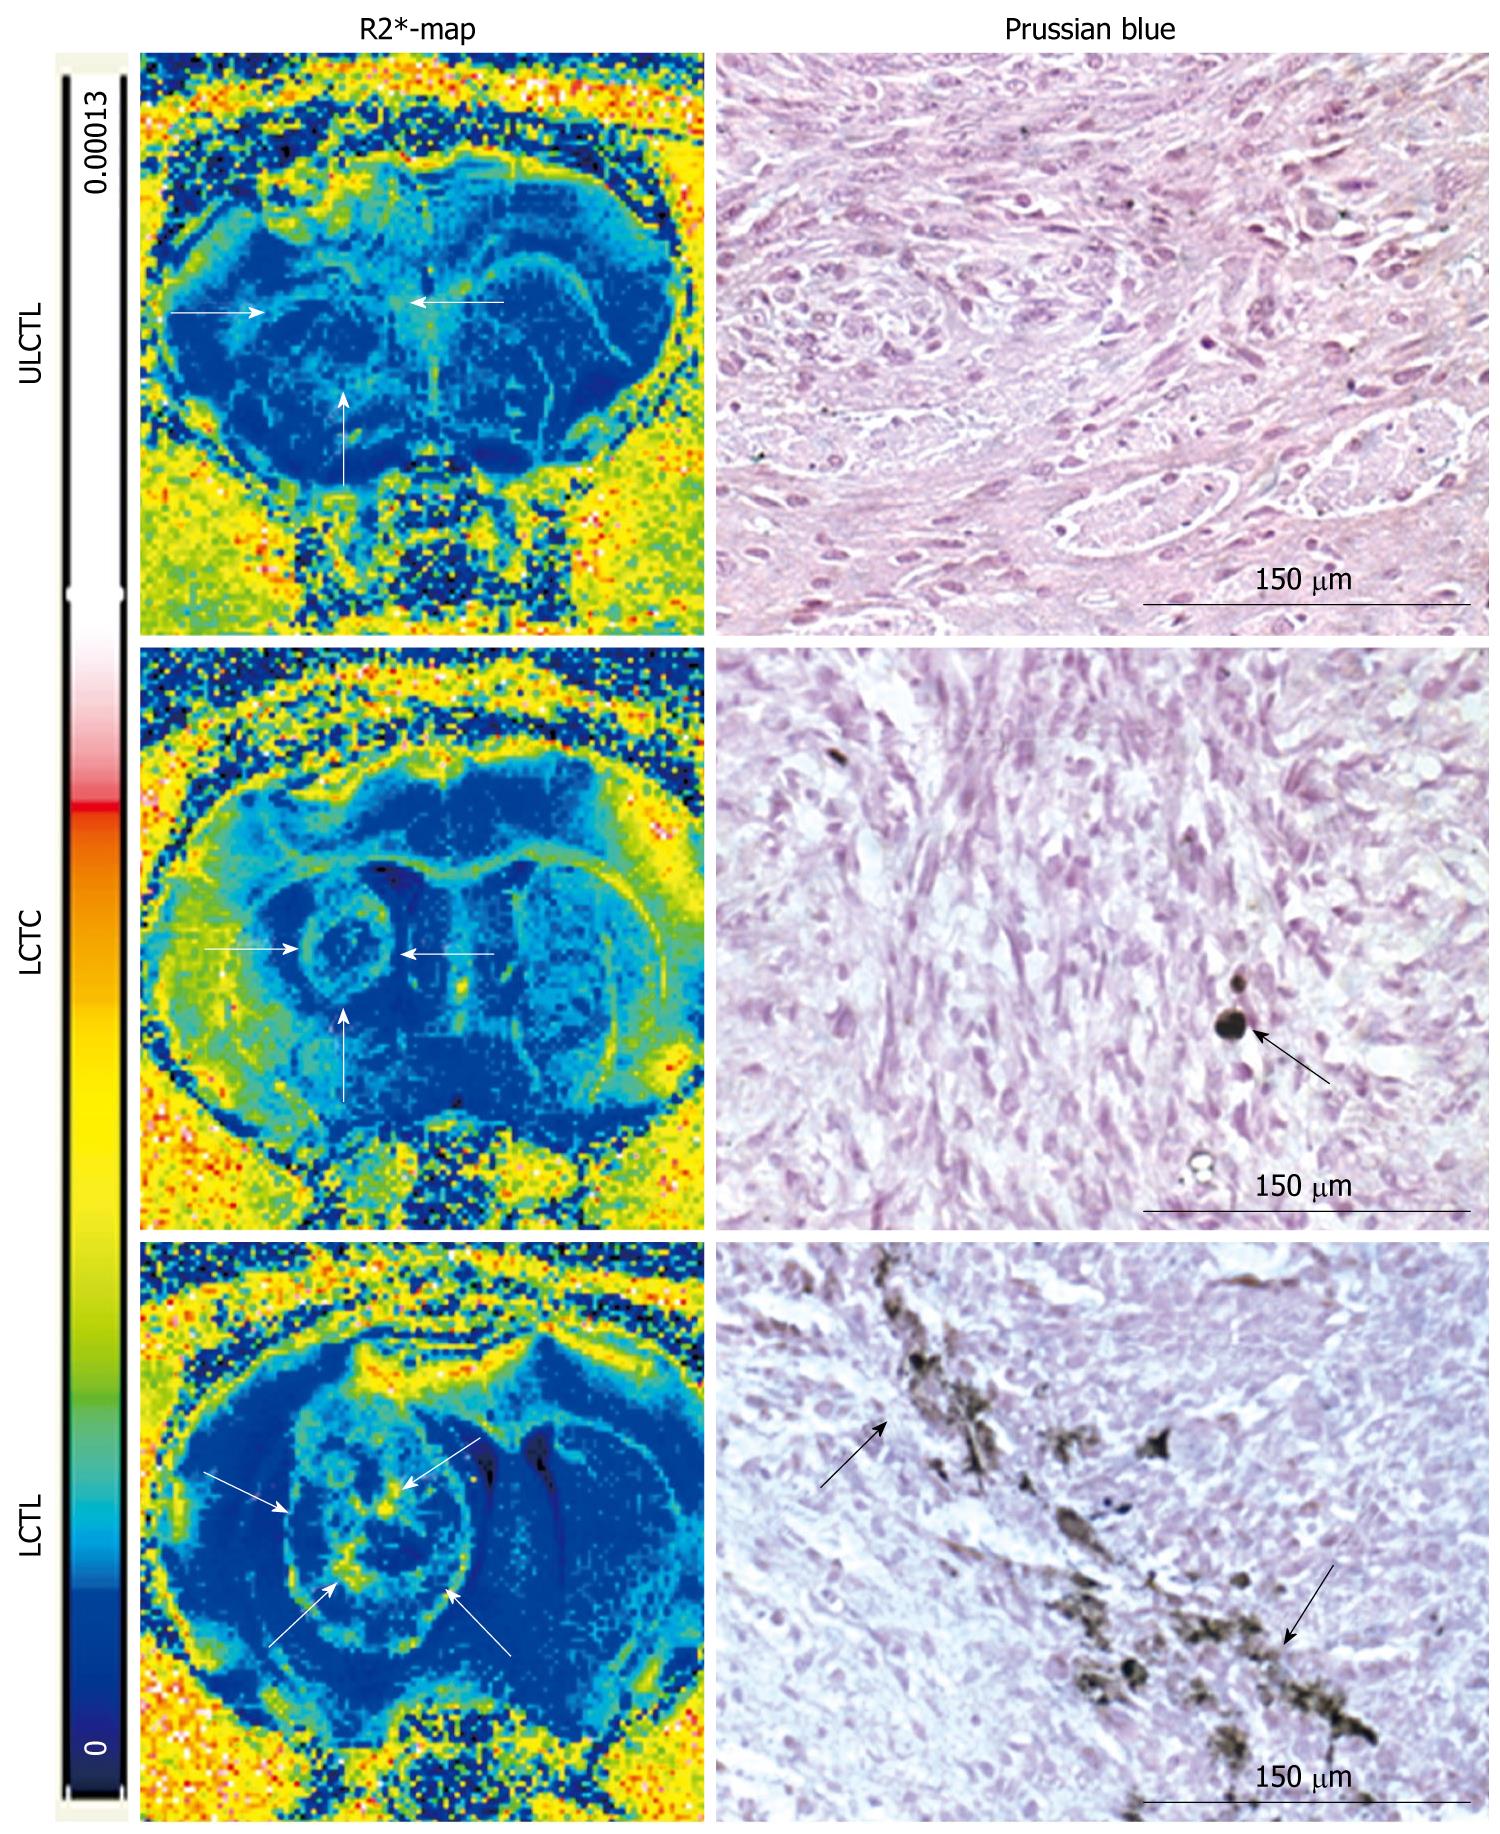
Figure 5 Magnetic resonance imaging relaxivity maps and Prussian blue staining.
R2* maps and DAB enhanced Prussian blue staining from representative animals that received unlabeled cytotoxic T-cells (CTLs) (ULCTL, upper row), labeled control T-cells (LCTC, middle row) and labeled CTLs (LCTL, lower row). R2* maps show high signal intensity areas only in tumors that received LCTC and LCTL. Animals that received LCTL show high signal intensity areas both at the peripheral and central part of the tumors (arrows). Corresponding DAB enhanced Prussian blue staining show multiple Prussian blue positive cells in tumors that received LCTL (arrows). There are a few Prussian blue positive cells seen in tumors that received LCTC (arrow). No definite Prussian blue positive cells were seen in tumors that received ULCTL.
- Citation: Arbab AS. Cytotoxic T-cells as imaging probes for detecting glioma. World J Clin Oncol 2010; 1(1): 3-11
- URL: https://www.wjgnet.com/2218-4333/full/v1/i1/3.htm
- DOI: https://dx.doi.org/10.5306/wjco.v1.i1.3


