Copyright
©The Author(s) 2018.
World J Gastrointest Pharmacol Ther. Feb 6, 2018; 9(1): 8-13
Published online Feb 6, 2018. doi: 10.4292/wjgpt.v9.i1.8
Published online Feb 6, 2018. doi: 10.4292/wjgpt.v9.i1.8
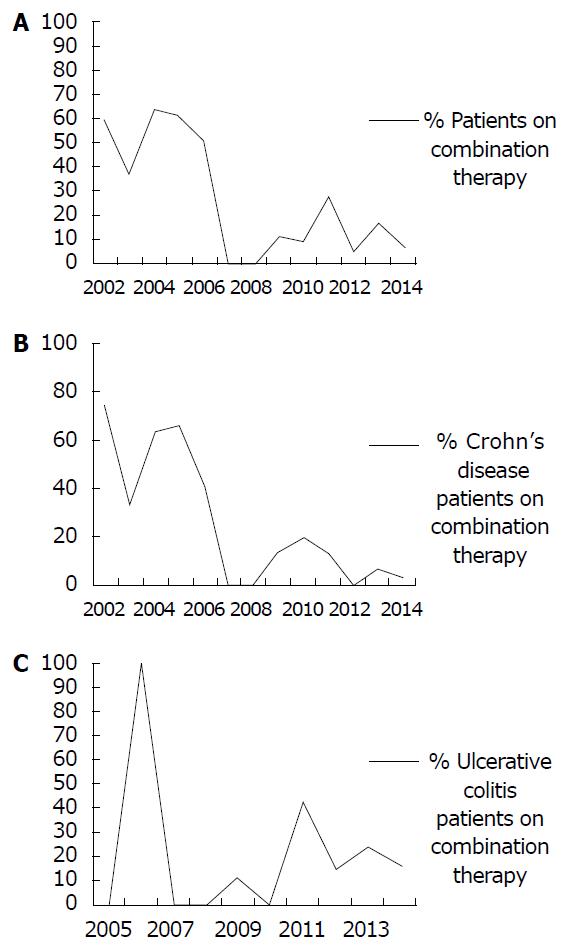
Figure 1 Percentage of inflammatory bowel disease (A), Crohn’s disease (B), and ulcerative colitis (C) patients on combination therapy.
Y axis: Percentage of infusion patients receiving combination therapy (0-100%); X axis: Year for which data is being reported (2002-2014). A: Percentage of inflammatory bowel disease patients receiving combination therapy over time; B: Percentage of Crohn’s disease patients receiving combination therapy over time; C: Percentage of ulcerative colitis patients receiving combination therapy over time.
- Citation: Berkowitz JC, Stein-Fishbein J, Khan S, Furie R, Sultan KS. Declining use of combination infliximab and immunomodulator for inflammatory bowel disease in the community setting. World J Gastrointest Pharmacol Ther 2018; 9(1): 8-13
- URL: https://www.wjgnet.com/2150-5349/full/v9/i1/8.htm
- DOI: https://dx.doi.org/10.4292/wjgpt.v9.i1.8


