Copyright
©The Author(s) 2016.
World J Gastrointest Pharmacol Ther. Nov 6, 2016; 7(4): 579-583
Published online Nov 6, 2016. doi: 10.4292/wjgpt.v7.i4.579
Published online Nov 6, 2016. doi: 10.4292/wjgpt.v7.i4.579
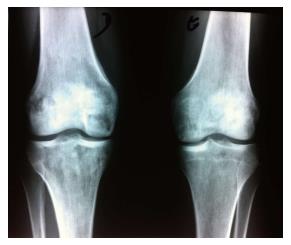
Figure 1 Plain film radiographs (bilateral knees) showing multiple bilateral hypotransparent areas.
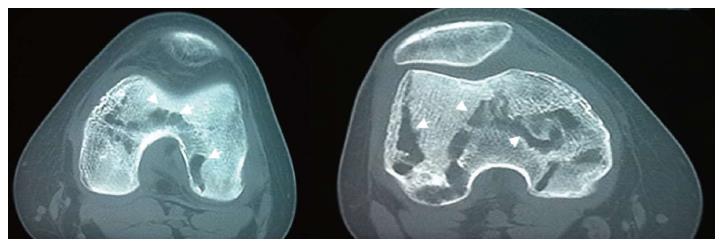
Figure 2 Computed tomography showing multiple lacunar areas in the femurs and patellas.
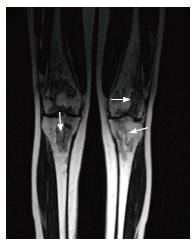
Figure 3 Magnetic resonance imaging (bilateral knees, T1-weighted images, coronal view) showing areas and serpiginous rims of low signal intensity in the femurs, tibiae and patellas, characteristic of osteonecrosis.
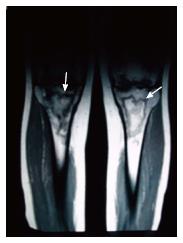
Figure 4 Magnetic resonance imaging (bilateral knees, T2-weighted images, coronal view) showing prominent medullary infarcts.
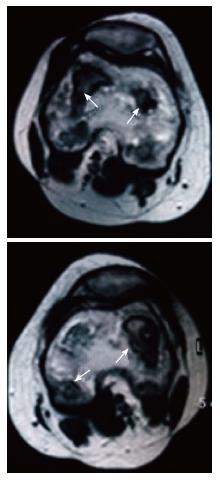
Figure 5 Magnetic resonance imaging (T2-weighted images, axial view) showing low signal serpiginous rims.
- Citation: Barbosa M, Cotter J. Osteonecrosis of both knees in a woman with Crohn's disease. World J Gastrointest Pharmacol Ther 2016; 7(4): 579-583
- URL: https://www.wjgnet.com/2150-5349/full/v7/i4/579.htm
- DOI: https://dx.doi.org/10.4292/wjgpt.v7.i4.579


