Copyright
©The Author(s) 2017.
World J Gastrointest Pathophysiol. May 15, 2017; 8(2): 67-76
Published online May 15, 2017. doi: 10.4291/wjgp.v8.i2.67
Published online May 15, 2017. doi: 10.4291/wjgp.v8.i2.67
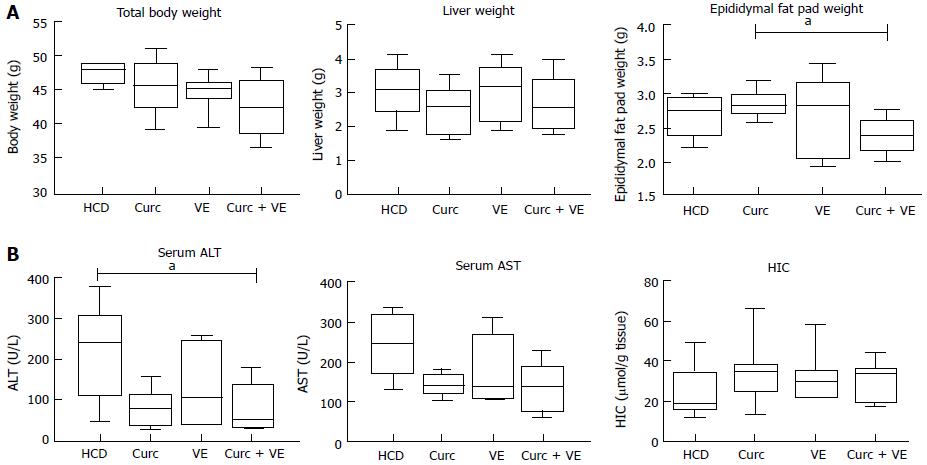
Figure 1 Epididymal fat pad weights and serum transaminase concentrations are decreased by curcumin and vitamin E combination therapy.
Hfe-/- mice were fed HCD for 10 wk then HCD + Cu, HCD + VE or HCD + Cu + VE for a further 10 wk (n = 7-9). A: Body, liver and epididymal fat pad weights were determined. B: Serum alanine aminotransferase (ALT) and aspartate aminotransferase (AST) concentrations were determined on final cardiac bleeds. Following sacrifice, a dried liver segment was digested to determine hepatic iron concentration (HIC). Data are depicted using box and whisker plots showing median, minimum and maximum values. Statistical significance was tested using Kruskal-Wallis test with Dunn’s correction for multiple comparisons, aP ≤ 0.05. HCD: High calorie diet; Cu: Curcumin; VE: Vitamin E.
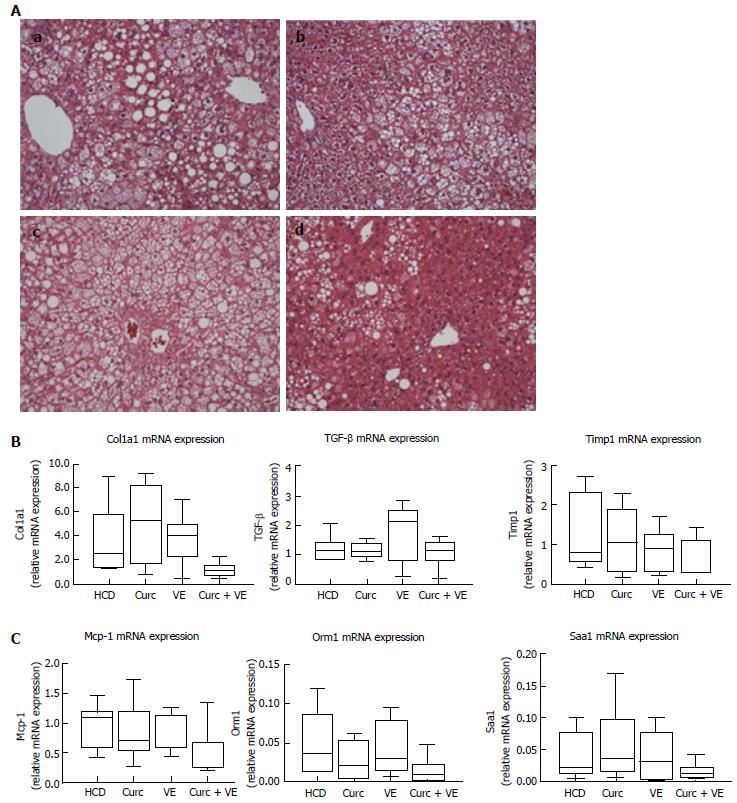
Figure 2 Steatosis is attenuated by curcumin and vitamin E combination therapy while the expression of fibrotic and inflammatory genes are not significantly altered.
A: Representative liver paraffin-embedded sections stained with hematoxylin and eosin (H and E) (original magnification × 20). a: Hfe-/- mice (n = 7-9 per group) fed HCD (20 wk); b: HCD (10 wk) then HCD + 1% curcumin (10 wk); c: HCD (10 wk) then HCD + 1.5% vitamin E (10 wk); d: HCD (10 wk) then HCD + 1% curcumin + 1.5% vitamin E (10 wk). qRT-PCR was used to determine expression levels of hepatic (B) fibrogenic genes: α1(I)-procollagen (Col1a1); Transforming growth factor β (TGF-β); Tissue inhibitor of metalloproteinase 1 (Timp1); C: Hepatic inflammatory genes: monocyte chemoattractant protein-1 (Mcp-1); orosmucoid 1 (Orm1) and serum amyloid A 1 (Saa1). Data are depicted using box and whisker plots showing median, minimum and maximum values. Statistical significance was tested using Kruskal-Wallis test with Dunn’s correction for multiple comparisons. HCD: High calorie diet; Cu: Curcumin; VE: Vitamin E.
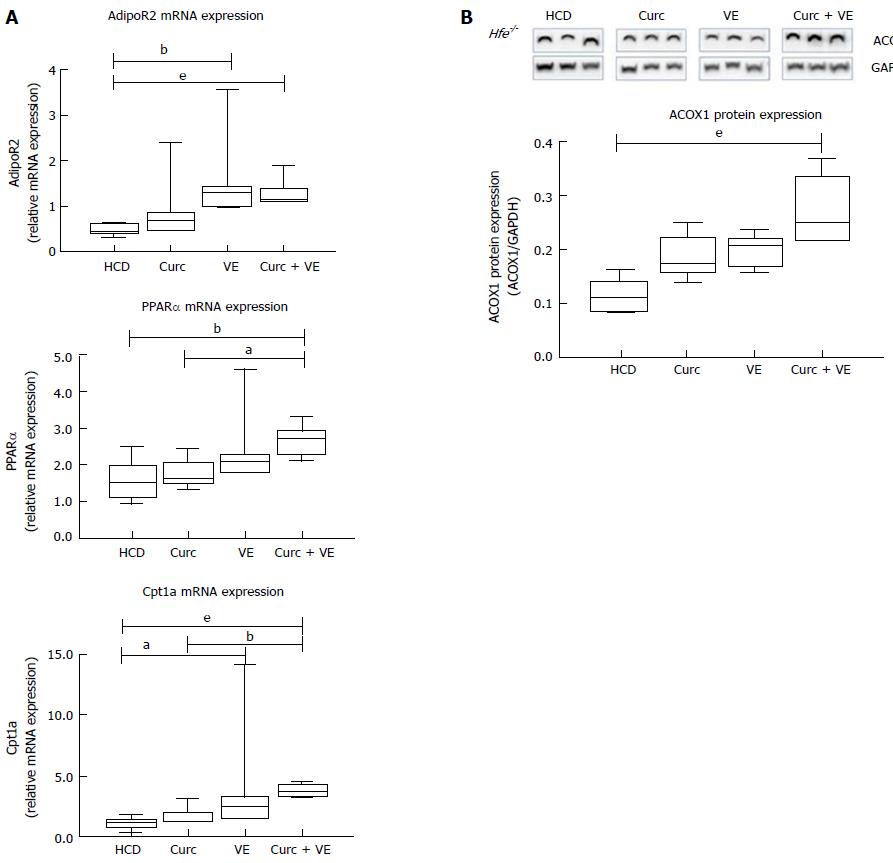
Figure 3 Altered lipid signalling following high calorie diet feeding is abrogated by curcumin and vitamin E combination therapy.
qRT-PCR was used to determine expression levels of hepatic fatty acid oxidation genes in Hfe-/- mice fed HCD, HCD + Cu, HCD + VE or HCD + Cu + VE. A: Adiponectin receptor 2 (AdipoR2) mRNA; peroxisome proliferator-activated receptor α (PPARα) and carnitine palmitoyl transferase 1A (Cpt1a) mRNA; B: Western blotting and densitometry analysis was performed to determine levels of acyl-coenzymeA oxidase 1 (ACOX) and glyceraldehyde 3-phosphate dehydrogenase (Gapdh). Data are depicted using box and whisker plots showing median, minimum and maximum values. Statistical significance was tested using Kruskal-Wallis test with Dunn’s correction for multiple comparisons, aP ≤ 0.05, bP ≤ 0.01, eP ≤ 0.001. HCD: High calorie diet; Cu: Curcumin; VE: Vitamin E.
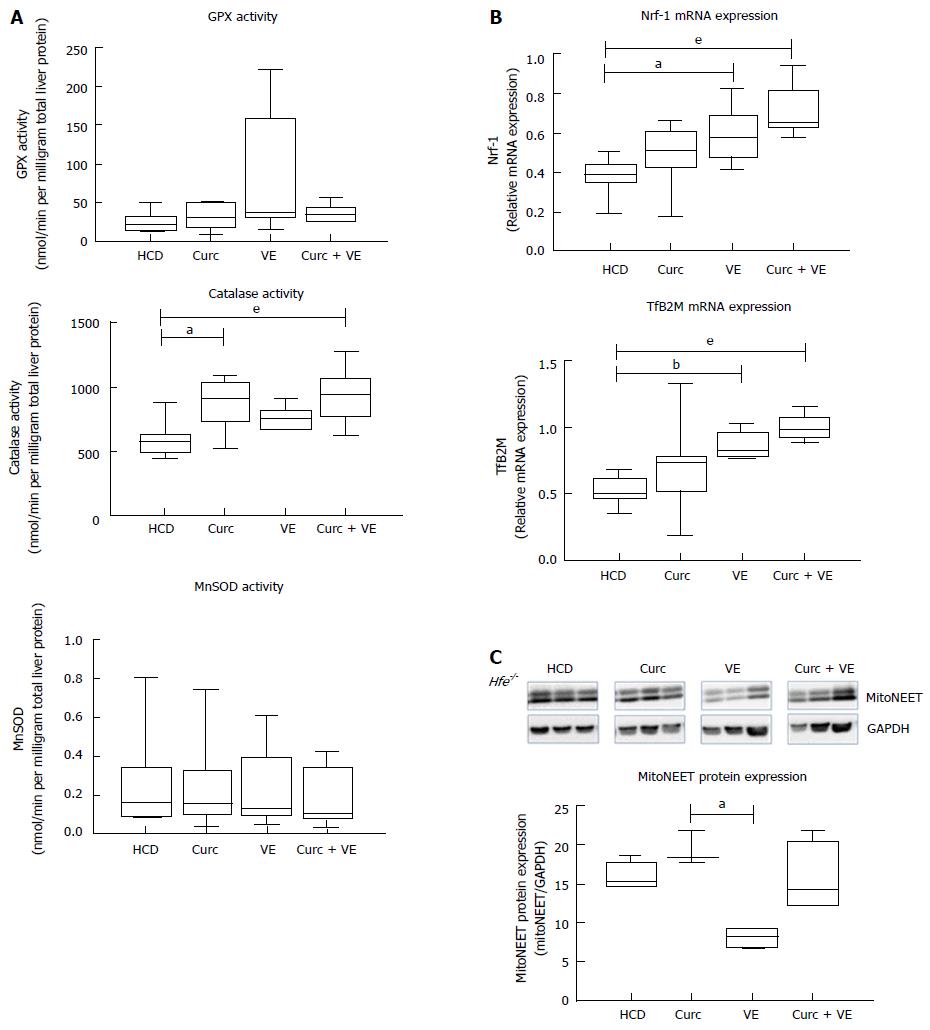
Figure 4 Curcumin and vitamin E treatments increase hepatic antioxidant enzyme activities and increase mitochondrial biogenesis.
Hepatic tissue from Hfe-/- mice fed HCD for 10 wk then HCD + Cu, HCD + VE or HCD + Cu + VE for a further 10 wk (n = 7-9) was analysed for (A) glutathione peroxidase (GPx) activity, catalase activity and mitochondrial superoxide dismutase (MnSOD) activity. qRT-PCR was used to determine expression levels of hepatic (B) nuclear transcription factor 1 (Nrf-1) and transcription factor B2 mitochondrial (TfB2M). C: Western blotting and densitometry analysis was performed to determine levels of hepatic mitoNEET and glyceraldehyde 3-phosphate dehydrogenase (Gapdh). Data are depicted using box and whisker plots showing median, minimum and maximum values. Statistical significance was tested using Kruskal-Wallis test with Dunn’s correction for multiple comparisons, aP ≤ 0.05, bP ≤ 0.01, eP ≤ 0.001. HCD: High calorie diet; Cu: Curcumin; VE: Vitamin E.
- Citation: Heritage M, Jaskowski L, Bridle K, Campbell C, Briskey D, Britton L, Fletcher L, Vitetta L, Subramaniam VN, Crawford D. Combination curcumin and vitamin E treatment attenuates diet-induced steatosis in Hfe-/- mice. World J Gastrointest Pathophysiol 2017; 8(2): 67-76
- URL: https://www.wjgnet.com/2150-5330/full/v8/i2/67.htm
- DOI: https://dx.doi.org/10.4291/wjgp.v8.i2.67


