Peer-review started: April 30, 2015
First decision: October 27, 2015
Revised: November 5, 2015
Accepted: December 3, 2015
Article in press: December 4, 2015
Published online: January 28, 2016
Processing time: 271 Days and 18.6 Hours
AIM: To study the leakage-penumbra (LP) effect with a proposed correction method for the step-and-shoot intensity modulated radiation therapy (IMRT).
METHODS: Leakage-penumbra dose profiles from 10 randomly selected prostate IMRT plans were studied. The IMRT plans were delivered by a Varian 21 EX linear accelerator equipped with a 120-leaf multileaf collimator (MLC). For each treatment plan created by the Pinnacle3 treatment planning system, a 3-dimensional LP dose distribution generated by 5 coplanar photon beams, starting from 0o with equal separation of 72o, was investigated. For each photon beam used in the step-and-shoot IMRT plans, the first beam segment was set to have the largest area in the MLC leaf-sequencing, and was equal to the planning target volume (PTV). The overshoot effect (OSE) and the segment positional errors were measured using a solid water phantom with Kodak (TL and X-OMAT V) radiographic films. Film dosimetric analysis and calibration were carried out using a film scanner (Vidar VXR-16). The LP dose profiles were determined by eliminating the OSE and segment positional errors with specific individual irradiations.
RESULTS: A non-uniformly distributed leaf LP dose ranging from 3% to 5% of the beam dose was measured in clinical IMRT beams. An overdose at the gap between neighboring segments, represented as dose peaks of up to 10% of the total BP, was measured. The LP effect increased the dose to the PTV and surrounding critical tissues. In addition, the effect depends on the number of beams and segments for each beam. Segment positional error was less than the maximum tolerance of 1 mm under a dose rate of 600 monitor units per minute in the treatment plans. The OSE varying with the dose rate was observed in all photon beams, and the effect increased from 1 to 1.3 Gy per treatment of the rectal intersection. As the dosimetric impacts from the LP effect and OSE may increase the rectal post-radiation effects, a correction of LP was proposed and demonstrated for the central beam profile for one of the planned beams.
CONCLUSION: We concluded that the measured dosimetric impact of the LP dose inaccuracy from photon beam segment in step-and-shoot IMRT can be corrected.
Core tip: This manuscript contains discussion of the effect of inter-leaf leakage in multileaf collimator (MLC)-based step-and-shoot intensity-modulated radiotherapy (IMRT) of cancer, and presents a method to measure and correct for this effect. Based on our experience, and as illustrated with a single IMRT plan, we recommend adjusting the width of treatment field for different segments delivered in the step-and-shoot fashion (to reduce overlap effects), and possibly, to include leakage as optimization parameter in treatment planning. In this study, we introduced a novel empirical model for determining the 2-dimensional distribution of dose resulting from transmission through the MLC.
- Citation: Grigorov GN, Chow JC. Leakage-Penumbra effect in intensity modulated radiation therapy step-and-shoot dose delivery. World J Radiol 2016; 8(1): 73-81
- URL: https://www.wjgnet.com/1949-8470/full/v8/i1/73.htm
- DOI: https://dx.doi.org/10.4329/wjr.v8.i1.73
Intensity modulated radiation therapy (IMRT) has become a standard treatment technique for many types of cancers such as prostate, head and neck, and breast[1-5]. To achieve an accurate and precise IMRT delivery, treatment planning systems such as Pinnacle3 made an effort on the multileaf collimator (MLC) modeling in order to reduce the dosimetric uncertainties associated within the treatment head and console control. This dosimetric issues include the overshoot effect (OSE), segment positional error resulting from the combination of high dose rate (DR), low number of MU per segment (MU/seg), segment offset and the change in the beam profile (BP) produced by the leaf leakage-penumbra (LP) effect. Generally, these effects change the 3-dimensional (3D) dose distribution in the planning target volume (PTV). The combined influence increases the planned dose proportionally with the number of beams and segments, the DR and the MU/seg. It depends also on the design of the MLC. Increased dose to the PTV increases the dose at the intersections between the PTV and organ at risks (OAR). As a result, these critical structures would have an increased mean dose and normal tissue complication probability (NTCP). There is also a risk of having a hot spot at the PTV. The integrated dose error of the OSE, positional error and LP doses can lead to significant discrepancies between planned and delivered doses for the step-and-shoot IMRT, as well as patient complications.
The problem of high DR has been described in the literature as an OSE and is typically characterized by an excess dose delivered during the first segment of each beam of IMRT treatment[6-12]. The excess first segmental dose is the result of operating the linear accelerator at its dose-control limit. While the beam has control and monitoring of the delivered dose, the segmental dose is only controlled by the MLC pulse diagram, named “beam ON-OFF”. The leaf-positional errors are the result of motor speed limitations of the collimator and synchronization of the collimation with beam delivery. The excess dose delivered in the beam segments does not produce a machine interlock. The segmental leakage and penumbra dose effect depends on the beam parameters (energy, dose, number of segments and segment distribution). The LP depends on the jaw and MLC leaf design.
Ezzell et al[6] published a description of the OSE and the produced segmental dose redistribution. They suggested avoiding the problem by using a lower DR. Stell et al[7] compared recorded MLC “log-files” with the actual segment coordinates and planned coordinates. They also suggested avoiding the OSE and the positional error by using a lower DR when smaller MUs are used.
The integral segmental dose inaccuracy causes a significant migration of the delivered dose from the optimized real density matrix. The positional segment error, which depends on the segment offset, minimum MU/seg and DR, was measured for our linear accelerators to be within tolerances for all DRs for offsets up to 5.5 cm. For an offset of 9.5 cm, the positional error was > 2 mm for a DR of 600 MU/min[8,9]. The excess dose caused by the OSE, ranged from 0.1 to 0.6 MU per beam and increased with increasing DR between 100 MU/min and 600 MU/min. A quality assurance of the OSE and its correction methodology was discussed by Grigorov et al[10]. The leakage-penumbra dose inaccuracy adds a non-uniformly distributed dose through each beam. Grigorov et al[10,11] using the Pinnacle3 treatment planning system and a Varian 21 EX linear accelerator, reported a methodology for the correction of the OSE and segment positional error[10,11]. The method allows for the use of the maximum DR and a low MU/seg of the linear accelerator by recalculating the first and last segmental doses and leaf coordinates.
Leaf leakages of up to 4% for different MLC systems were reported[12]. Klein et al[13] reported an inter-leaf leakage from 3.6% to 3.2% for the 10 mm system and from 4.0% to 3.2% for a 5 mm leaf system. A MLC leakage of 1.68% for a 10 cm × 10 cm field[14], 6 MV, and an 80-leaf MLC (consisting of 1.48% direct transmission and 0.20% leaf scatter) was measured. Chow et al[15] published a measurement of the leaf leakage in the range of 2%-3% of the beam dose. Remarkably consistent penumbras and leakages were measured by Bayouth and Morrill[16] for different leaf positions of the double-focus MLC.
The segmental leakage and penumbras increase the delivered dose with respect to the plan and may limit the resolution of the IMRT beams. In a clinical case, the jaws surround the contour of the target with a specified margin. Segments of different MUs and shapes deliver the beam fluence to the PTV. The leakage dose, depending on the leaf design and material, and segment parameters, has a non-uniform dose distribution. Additionally, penumbra portions of each segment can change the planned segmental dose distribution.
The agreement between the planned and delivered dose for IMRT beams can be expressed as the difference between the BPs and the form of the dose-volume-histograms (DVH) of the PTVs and OARs. The qualification of the planning and X-ray treatment is widely based on the estimation of the tumour control probability (TCP) and NTCP. Therefore, it is important to guarantee as much as possible a correspondence between the planned and delivered dose distribution, DVH shapes, and calculated TCP/NTCP predictors. This paper presents a methodology for the measurement and correction of IMRT beam doses affected by non-uniform LP effects. The LP dose contamination can be determined with a treatment planning system and used as a 3D non-uniform dose profile for each beam to correct the delivered dose.
LP dose profiles were studied for a group of ten randomly selected prostate cancer patients planned for IMRT. The OAR and the target contours were outlined for each patient using the guidelines of the RTOG P-0126 protocol. Two PTVs with a 10 mm 3D uniform margin were generated: PTV1, which includes both seminal vesicles and the prostate, and PTV2, which includes the prostate only. The Rint, and Bint are, respectively, the rectum and bladder volumes of intersection with the PTV2. Volumes for various regions of interest were determined from CT scans with the Pinnacle3 contour option as follows: Prostate (17.3-84.6 cm3), seminal vesicles (10.1-20.2 cm3), rectum (88.7-274.2 cm3), bladder (55-485 cm3), left/right femurs (145-164 cm3), Rint (1.1-31.7 cm3), Bint (1.3-38.7 cm3), PTV2 (30.2-270.1 cm3), and PTV1 (61.2-323.4 cm3).
A 3D non-uniform LP distribution was investigated for all the prostate IMRT plans, which consisted of five coplanar beams starting from 0o with an equal separation of 72o. The dose limits were given for a specified volume (V) in Gy, e.g., V15 associated with R75 or B75 is a dose of 75 Gy to 15% of the rectum or bladder volume. The IMRT beams were optimized for an escalated treatment dose of 82 Gy in 41 fractions (Protocol P-0126). The description for PTV2 is: V1 = maxDose = 86 Gy (82 Gy + 5%); V95 = 82 Gy (prescription point, treatment dose of 82 Gy in 41 fractions), V99 = minDose = 78 Gy (82 Gy - 5 %). PTV1 had the same maxDose, V95 = 57 Gy (prescription point), V99 = 55 Gy (58 Gy - 5 %). DVH points of (V15-R75/B80), (V25-R70/B75), (V35-R65/B70) and (V50-R60/B65) were used for the maximum dose at the prescribed volume of OAR. To avoid the large number of segments per beam and the low MU/seg resulting from the conversion of the ideal density matrix to real density matrix, a minimum 6 MU/seg was chosen. For all ten plans the number of segments per beam ranged between 6 and 14 segments, the MU/fraction ranged from 520 to 610 MU, the MU/beam ranged from 89 to 125 MU and the MU/seg ranged from 6 to 42 MU. For all beams, the first segment had the largest area in the segmental sequence and was equal to the PTV contour and the chosen leaf margin. For the studied group of patients, the OSE and the segment positional error were measured in the range: The OSE was about 0.1 to 0.6 MU for a DR from 100 to 600 MU/min for the first segment of each beam; The segment positional error was less than 1 mm for a DR of 600 MU/min and an offset up to 5.5 mm.
IMRT resources at our facility include a Pinnacle3 treatment planning system, a Varian 21 EX linear accelerator (120-leaf MLC) and a V6 Varis Record/Verify system. The MLC shaper software V6.2 (Varian Medical System Inc) was used for the creation of clinical multi-segment IMRT beams. A group of sub-beams were created, where each had only one segment with planned segment weight, coordinates and segmental sequence of the original IMRT beam. The reported dose measurements were performed in a solid water phantom with Kodak (TL and X-OMAT V) films. A dosimetric analysis of the films was done with a film scanner (Vidar VXR-16 DOSIMETRYPRO).
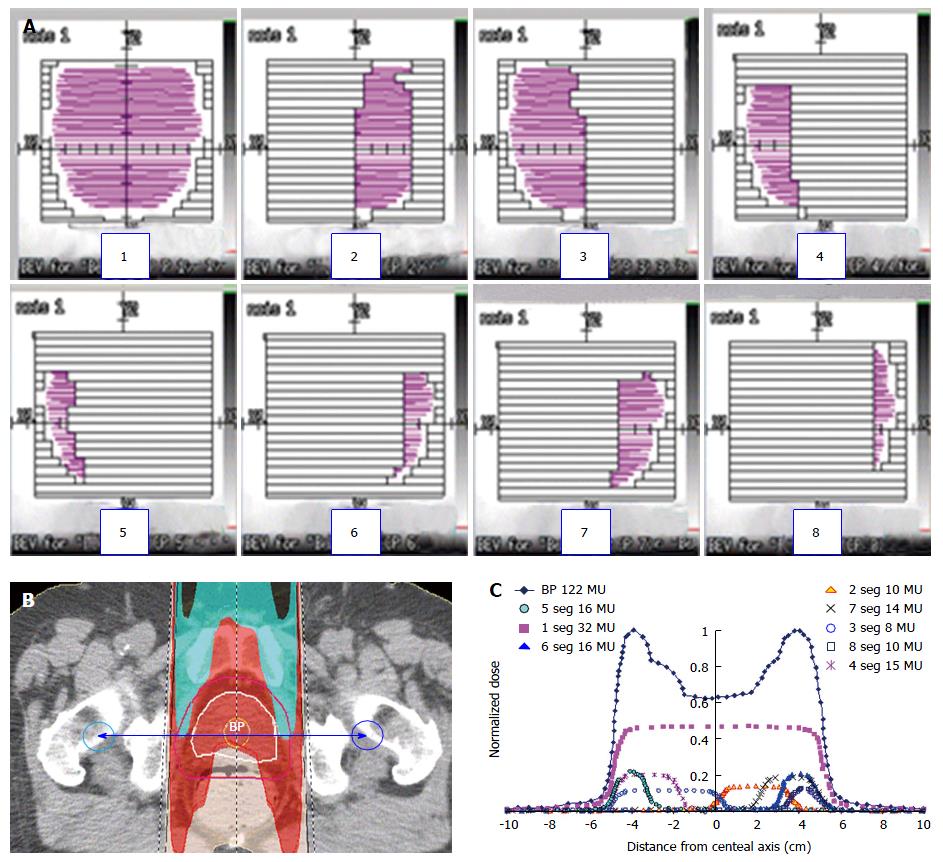
It is not technically possible to measure the LP dose profiles of IMRT beams, as an integrated dose of the segmental leakages and specified segment penumbras during the irradiation of the segmented beam. Each IMRT beam could have an overdose of the first segment as well as segment positional errors, depending on the DR and MU/seg. It is, however, possible to eliminate these two errors from the BP if the irradiation of the step-and-shoot IMRT beam is remade to be a static irradiation, where each segment of the segment sequence is irradiated individually. To eliminate OSE and demonstrate the LP contribution of each beam segment, the IMRT beam was separated into a group of sub-beams using Pinnacle3. Each new beam contained only one segment with its originally planned shape, direction and MUs. The group of sub-beams substituted the original segmental sequence of the IMRT beam with a sequence of statically irradiated segments. By separating the beam into sub-beams, the OSE and segment positional errors were avoided during the beam irradiation. Using this technique there were no positional errors because each segment was irradiated as a static beam avoiding the problems of the step-and-shoot technique. The linear accelerator tunes the leaf coordinates and controls the dose with maximal accuracy when the beam has only one segment. The OSE is represented in this study by the reordering of the segmental sequence. The individual segmental dose, in this new order, is monitored and controlled by the gantry beam control system (BCS). Basically, the accumulative fractional dose error of BCS is very small, less than 0.1 MU[6]. Using the static segmental dose delivery, a reference beam and segment profiles were created by TL film dosimetry. These profiles were compared to the profiles irradiated under dynamic MLC control. The original segmental doses were irradiated and measured individually in different segmental sequences. Figure 1A shows the shapes of eight beam segments with 32, 10, 8, 15, 17, 16, 14 and 10 MU/seg respectively. The transversal dose distribution of the same beam is shown in Figure 1B. The rectum contour is avoided by the higher PTV dose, as shown in the figure. The beam and the individual segment BPs are shown in Figure 1C. The plotted profiles were taken from the planning system between two points with ± 10 cm distance from the isocenter as shown in Figure 1B. The same beam segments were used for the study of the beam LP dose inaccuracy.
The segmental dose readings were obtained using a film set at the isocentre of the solid water phantom at a depth of 13 cm (simulating the depth of the isocenter from Figure 1). The X and Y jaws were set at the planned coordinates. The dose distribution of the segments, as shown in the figure, was prepared by the MLC shaper program.
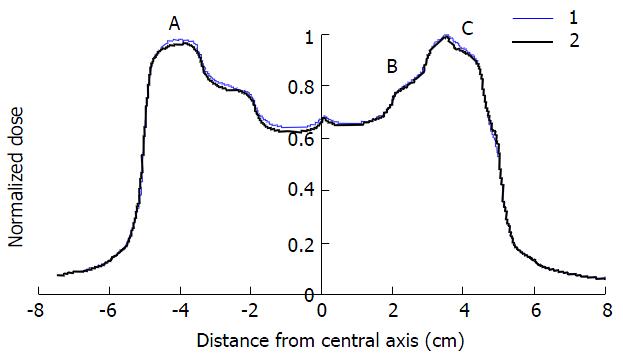
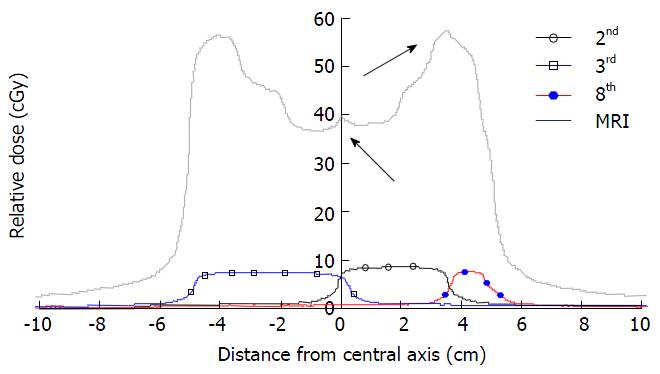
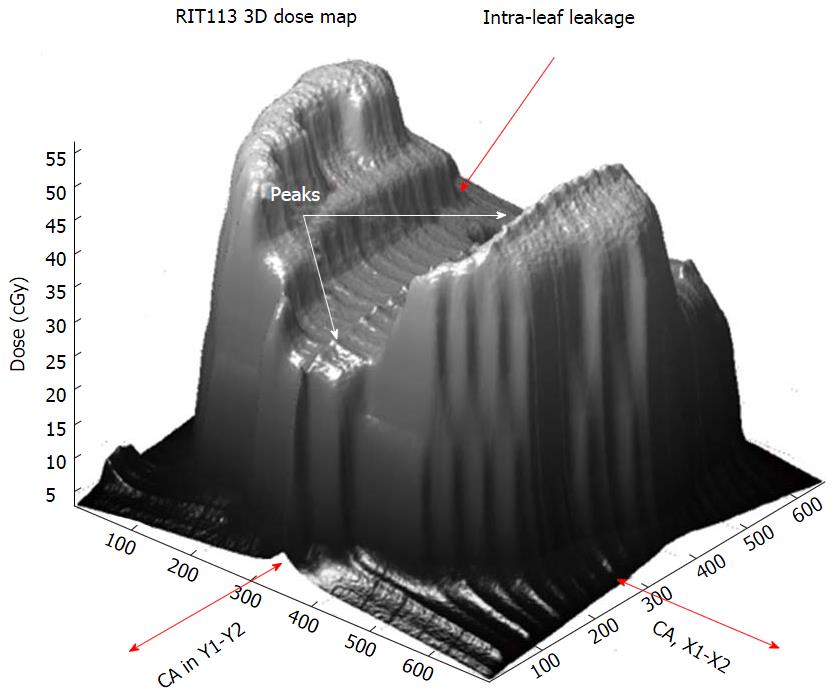
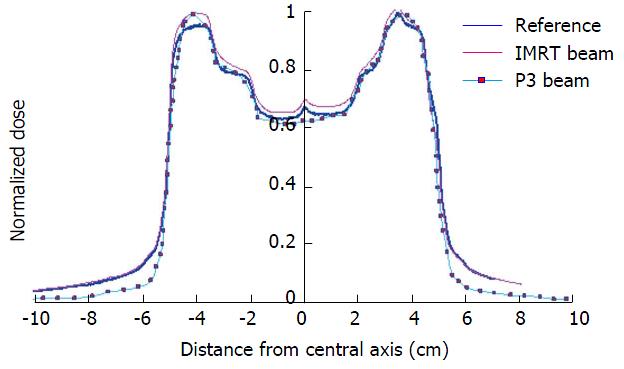
The dose inaccuracy of the first segment, caused by the OSE, is shown by BPs by the difference between the original and replaced first segment in the segment sequence. Figure 2 shows the difference between two beams: (1) planned IMRT (thin curve), where the first segment in the sequence had the biggest shape, as shown in Figure 1A; and (2) the same IMRT beam, but with changed placement of the first and second segments (bold curve) in the sequence. Both beams were irradiated with a DR of 600 MU/min. A difference between both profiles of about 0.6 cGy, caused by the OSE, is represented in the left-hand-side of the figure. The right-hand-side in both profiles shows equal OSE because in the same area the profiles are affected by equal OSE. Both BPs have the same LP dose distributions. The analyzed patients’ beams had a positional error less than the tolerance of ± 1 mm. Figure 3 shows the BPs of segments #3, #2 and #8 plotted in the square, empty and full circle dotted curves, respectively. The total BP is plotted bold curve. The peaks, shown by arrows in the figure, correspond to the penumbra effect in the gap between neighbouring segments (#2 and #3, and #2 and #8). The same effect in a 3D view is shown in the Figure 4. The significant difference between BPs planned in the Pinnacle3 V 6.2 and BPs measured in the phantom, as shown in Figure 5, is caused by integrated segmental dose errors as mentioned above: OSE and LP non-uniform dose distribution (overlapping of the penumbras between neighbouring segments), in the IMRT field.
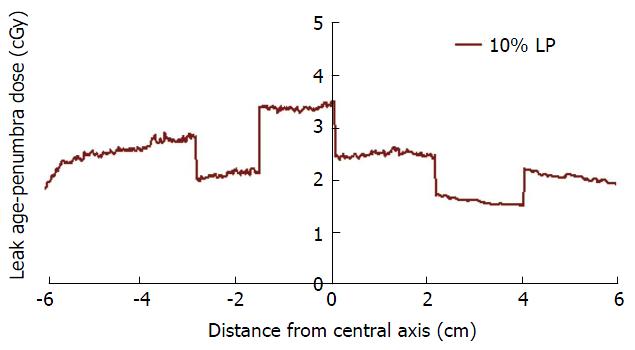
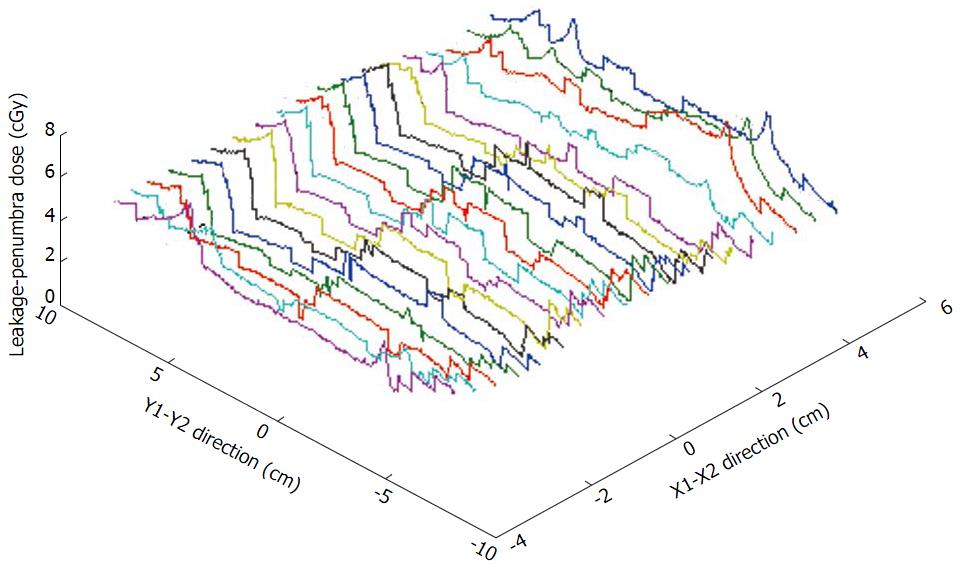
The 3D IMRT BP, as shown in Figure 4, indicates that the LP dose profile could have a 3D non-uniform shape. Measuring only the value of the LP dose distribution point by point is practically impossible. To represent the LP dose profile the following method was used. Each segment was irradiated individually on a separate film. Starting from the central axis in a step of 5 mm, were obtained profiles in each of Jaws’± Y directions for each segment with a scanner (Vidar VXR-16). Typical segment profiles distributions around the central axis are shown in Figure 1C. To simplify the model it will be represented at first using only one segment profile, from the isocenter. From the segment profile a portion of the profile representing the planned segmental dose (central part of the profile) was removed. The rest of the profiles, as shown in Figure 6, include only the leakages and dose penumbras from both-side. In the figure the LP profiles of the segments (Figure 3) are represented. The dose from the removed profile portion was determined by substituting the planned dose from the delivered. In this way, all segmental dose portions higher than 10% were extracted from the original segment profiles. Ten percent of the segmental dose was used as a cut-off penumbra level into LP. The value was determined experimentally by testing a range of penumbra levels from 2% to 50% in steps of 2% for a correction of the dose peaks, as shown in Figures 3 and 4.
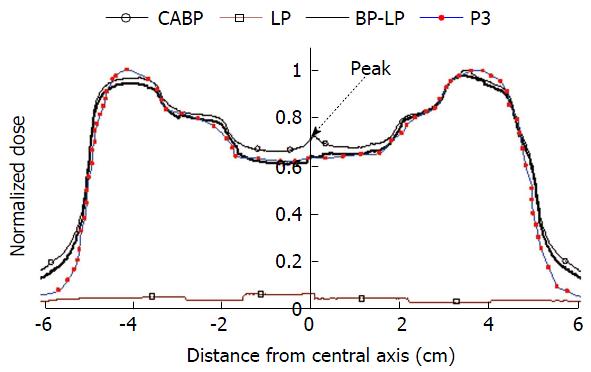
The LP profile, labelled “NU LP” in the figure has a non-uniform dose distribution ranging from 3% to 5% of the beam dose as shown in Figure 7. The thin curve with filled squares shows the Pinnacle3 BP. The BP measured in the solid water phantom is shown in the figure by a thin curve with empty squares. The bold black curve, labelled in the figure with “BP-LP,” shows the corrected beam dose at the isocenter. The LP dose profile “NU LP” was extracted from the initial BP. The dose picks, caused by the overlapping of the penumbras of the neighbouring segments (#2 and #3, and #2 and #8) were reduced by manually decreasing the segment width by 0.2 mm from both sides.
Two different beams were used to model the dose inaccuracy caused by the segment leakages and penumbras for the IMRT beam planned for prostate treatment: A Pinnacle3 treatment planning system and Varian 21 EX linear accelerator BPs. A 3D LP dose distribution for one anterior beam is show in Figure 8. The profiles readings were delivered at the same dosimetric point, as shown in Figure 2. The distance between the LP profiles was equal to 1 cm. The non-uniform LP dose distribution, depending on the segmental dose, position arrangement in the beam field, and the number of segments, is shown in the figure.
A simplified method as an initial approximation for the correction of the LP effects, as represented in Figure 7, includes only a correction of the isocenter BP (Figure 1B). The LP profile was extracted from the originally irradiated BP at the same place. The peak over-doses, caused by the penumbras overlapping, were corrected by decreasing the width of segment #2. Having the 3D LP distribution for each beam makes it possible to include them in the planning system as variables for the objective function.
Mathematically, the reconstruction of the non-uniform LP function may be calculated by Eq. 1:
Math 1
Where S is the segment number. DS is the segmental dose. a is a variable, related to the leakage background as a percentage from the DS. (bS x e-K) is the penumbra percentage from the maximum segmental dose and K is the distance from the board of the segment to the point of calculation (x,y). The value of a depends on the leaf design and material, and on the beam dose and energy which may be different for each MLC system (2.5% to 3% were measured for our MLC). The dose contribution to the penumbra of photon IMRT beams as shown in Eq.1 contains several components, which depend on the peripheral dose deposition from every beam segment. Ds has the highest impact because it is the dose of the closer segment irradiated to the point (x,y). Another dose component is the photon leakage-scatter from the closed leaves at the jaw field opening when a particular segment is delivered. The value of the component is about 2%-3% from the Ds. The parameters b and K are related to the geometry and materials used to produce the jaw-collimator system. These two components represent about 0.5% of dose from the entire IMRT beam.
For the Varian 21 EX linear accelerator, it was determined experimentally, that b = 10% from the maximum segmental dose can be used for the reconstruction of the penumbra component of the LP non-uniform dose. Eq. 1 describes the dose for each point being outside of the segment shape. When the calculating point is on the board of the segment field size, K = 0 and the point has all 10% from the segmental dose. For calculating points, staying inside the field size, the own LP components have to be substituted with a zero dose. In the model, the dose of the inside points of each segment is influenced only by the LP components for the rest of the segments.
To reconstruct the LP profile, the coordinates of jaws and leaf control point for every beam segment are needed. The dose per beam and segmental dose are also used to calculate the LP dose for the penumbra points (xs,ys), where S = 1 to i (i = total number of segments). For example, assuming the IMRT beam has only one segment of 100 MU. The dose at a point of 10 cm depth from the periphery of segment would have a dose of Ds = 1 MU calculated by the dose according to the inverse square law (i.e., 100/102). If over the same point the leaves are closed during the dose delivery, 2% to 3% of the beam dose has to be added (i.e., aS = 2-3 MU). Therefore, the component bS×e-K is about 0.5% of dose per beam. If materials of higher or lower atomic number is used to produce the jaws and leaves, the component of bS×e-K will increase or decrease according to the atomic number of the materials, respectively.
Segment positional errors were not found in any planned beams for the studied group of prostate cancer patients. Although the beams were irradiated with a DR of 600 MU/min, the error was less than the maximum tolerance of 1 mm. The OSE, depending on the DR, was observed in all beams. OSE increases the dose of the first segment, which for all beams had the biggest shape in the segment sequence. For all plans, an increase of 1 to 1.3 Gy/treatment of the rectum intersection caused by the OSE was found.
Pinnacle3, probably does not correct the penumbra effect in the gap between neighbouring segments. Figure 1C presents the Pinnacle3 BP without any peaks in the dose, while the profiles in Figures 3 and 4 show the peaks produced by the neighbouring segments (#2 and #3, and #2 and #8). The LP effects increase the dose to the PTV and consequently the dose to the surrounding critical areas. The effect has a typical 3D influence and proportionally depends on the number of beams and segments for each beam. The clinical significance of LP correction is related to the patients’ post-radiation effects (NTCP)[17]. A non-uniform increase of the beam dose by approximately of 3% to 5% (1-2 Gy/fraction) was presented[8]. The lower limit for minimum MU/seg in the case of a non-uniform LP dose distribution could possibly be specified by the Whitteker-Kotelnikov-Nyquist-Shannon sampling theorem. The segmental dose delivery can be imagined as an analog and continuous integrated signal, which could be primary disadvantaged with a noise of two components. The first is the permanent leaf leakages, which depend on the signal (beam dose) value. The second is the variation of the percentage of the segment penumbras distributed in the field as dose peaks. The position of the peaks depends on the generation of the segment sequence by the conversion of the ideal density matrix to the real one. The sampling theorem can be used to obtain a dose/leakage (D/L) ratio of discrete values. The theorem stating that[18]: When sampling a signal, the sampling frequency must be greater than twice the bandwidth of the input signal in order to be able to reconstruct the original perfectly from the sampled version. The theorem states the resolution and accuracy of the wave reconstruction. In term of the D/L ratio, the theorem could be used to specify for IMRT beams a “sampling condition” 2D > L. The minimum treatment dose (Dmin) has to be greater than twice of the 2 times maximum leakage (Lmax), is the statement of the sampling theorem for the IMRT dose delivery. The D/L ratio can be represented in dB by the popular equation: D/L = 20 log10(Dmin/Lmax). The permanent portion of the leakages was measured for our MLC system about 2%-3% from the beam dose. This determines the limit for IMRT segmental D/L background in the range from approximately 33.97 to 30.45 dB. Similarly, the segmental penumbra is about 20 dB from the segmental dose. The lower limit for MU/seg can be determined automatically by the treatment planning system if the LP correction is included in the objective function calculation.
The influence of the dose in the rectum intersection of about 2-3 Gy, caused by an integration of the OSE and LP effects, may result in a significant increase in the rectum post-radiation effects. The correction of LP was demonstrated only for the central BP for one of the planned beams. However the described model and equation allows for the implementation of the LP function as a 3D variable into the objective function for the beam apertures optimization. The complex benefits for step-and-shoot IMRT beams can only be realized through the application of the inverse planning technique including LP optimization and the methodology for OSE and leaf positional error correction[8]. Both components, may not be equal for different equipments (MLC), have to be measured individually.
In conclusion, Leakage-penumbra dose inaccuracy of the MLC segments is a limiting factor in step-and-shoot IMRT delivery when beams of high multi-segmentation and low MU are used. A leakage background of about 30.5-34 dB modulated by a penumbra of about 20 dB from the segmental dose was used to express the 3D non-uniform profile of the LP function for an IMRT beam used for prostate planning. The combined dose inaccuracy (OSE, positional errors and LP) can significantly redistribute the planned dose and overdose the OARs. It is technically difficult to eliminate the leakages and penumbras from the segmented field. However, by implementing the methodology described in this paper into the objective function, it is possible to improve the agreement between planned and delivered doses.
This research was supported by the Medical Physics Department of GRRCC, Kitchener, Ontario. The authors would like to thank all the staff in the department for their assistance.
This work presents a method to correct the inter-leaf leakage effect of the multileaf collimator in the step-and-shoot intensity modulated radiotherapy.
The authors’ proposed method can increase the accurancy of radiation dose delivery using the step-and-shoot intensity modulated radiation therapy technique.
The method recommends to adjust the width of treatment field for different segments to reduce the overlap effects.
Step-and-shoot intensity modulated radiotherapy.
The article is well written and the authors are very knowledgeable in their field.
P- Reviewer: Sergi C
S- Editor: Qi Y L- Editor: A E- Editor: Li D
| 1. | Gautam B. Literature review on IMRT and VMAT for prostate cancer. Available from: http://ivyunion.org/index.php/ajcr/. |
| 2. | Elith C, Dempsey S E, Findlay N, Warren-Forward H M. An introduction to the intensity-modulated radiation therapy (IMRT) techniques, tomotherapy and VMAT. J Med Imag Rad Sci. 2011;42:37-43. [RCA] [DOI] [Full Text] [Cited by in Crossref: 22] [Cited by in RCA: 30] [Article Influence: 2.1] [Reference Citation Analysis (0)] |
| 3. | Garden AS, Morrison WH, Rosenthal DI, Chao KS, Ang KK. Target coverage for head and neck cancers treated with IMRT: review of clinical experiences. Semin Radiat Oncol. 2004;14:103-109. [RCA] [PubMed] [DOI] [Full Text] [Cited by in Crossref: 55] [Cited by in RCA: 50] [Article Influence: 2.4] [Reference Citation Analysis (0)] |
| 4. | Bortfeld T. IMRT: a review and preview. Phys Med Biol. 2006;51:R363-R379. [RCA] [PubMed] [DOI] [Full Text] [Cited by in Crossref: 299] [Cited by in RCA: 260] [Article Influence: 13.7] [Reference Citation Analysis (0)] |
| 5. | Wang TJC, Riaz N, Cheng SK, Lu JJ, Lee NY. Intensity-modulated radiation therapy for nasopharyngeal carcinoma: a review. J Radiat Oncol. 2012;1:129-146. [RCA] [DOI] [Full Text] [Cited by in Crossref: 50] [Cited by in RCA: 23] [Article Influence: 1.8] [Reference Citation Analysis (0)] |
| 6. | Ezzell GA, Chungbin S. The overshoot phenomenon in step-and-shoot IMRT delivery. J Appl Clin Med Phys. 2001;2:138-148. [RCA] [PubMed] [DOI] [Full Text] [Cited by in Crossref: 47] [Cited by in RCA: 42] [Article Influence: 1.8] [Reference Citation Analysis (0)] |
| 7. | Stell AM, Li JG, Zeidan OA, Dempsey JF. An extensive log-file analysis of step-and-shoot intensity modulated radiation therapy segment delivery errors. Med Phys. 2004;31:1593-1602. [RCA] [PubMed] [DOI] [Full Text] [Cited by in Crossref: 79] [Cited by in RCA: 83] [Article Influence: 4.2] [Reference Citation Analysis (1)] |
| 8. | Grigorov G, Barnett R B and Chow J C L. IMRT prostate planning-determination of the MU per segment. Med Phys. 2005;32:233-234. [RCA] [DOI] [Full Text] [Cited by in Crossref: 1] [Cited by in RCA: 1] [Article Influence: 0.1] [Reference Citation Analysis (0)] |
| 9. | Grigorov GN, Chow JC, Barnett RB. Dosimetry limitations and a dose correction methodology for step-and-shoot IMRT. Phys Med Biol. 2006;51:637-652. [RCA] [PubMed] [DOI] [Full Text] [Cited by in Crossref: 13] [Cited by in RCA: 14] [Article Influence: 0.7] [Reference Citation Analysis (0)] |
| 10. | Grigorov G, Barnett R B, Chow J C L. IMRT step and shoot technique - correction of segment dose delivery due to the overshoot effect. Biomed Techn. 2005;50:223-224. |
| 11. | Grigorov G, Chow J C L, Yazdani N. Dosimetry limitations and pre-treatment dose profile correction for sliding window IMRT. Int J Radiat Res. 2010;8:61-74. |
| 12. | Agnew CE, Irvine DM, Hounsell AR, McGarry CK. Improvement in clinical step and shoot intensity modulated radiation therapy delivery accuracy on an integrated linear accelerator control system. Pract Radiat Oncol. 2014;4:43-49. [RCA] [PubMed] [DOI] [Full Text] [Cited by in Crossref: 8] [Cited by in RCA: 10] [Article Influence: 0.8] [Reference Citation Analysis (0)] |
| 13. | Klein EE, Low DA. Interleaf leakage for 5 and 10 mm dynamic multileaf collimation systems incorporating patient motion. Med Phys. 2001;28:1703-1710. [RCA] [PubMed] [DOI] [Full Text] [Cited by in Crossref: 16] [Cited by in RCA: 17] [Article Influence: 0.7] [Reference Citation Analysis (0)] |
| 14. | Arnfield MR, Siebers JV, Kim JO, Wu Q, Keall PJ, Mohan R. A method for determining multileaf collimator transmission and scatter for dynamic intensity modulated radiotherapy. Med Phys. 2000;27:2231-2241. [RCA] [PubMed] [DOI] [Full Text] [Cited by in Crossref: 85] [Cited by in RCA: 89] [Article Influence: 3.6] [Reference Citation Analysis (0)] |
| 15. | Chow JC, Seguin M, Alexander A. Dosimetric effect of collimating jaws for small multileaf collimated fields. Med Phys. 2005;32:759-765. [RCA] [PubMed] [DOI] [Full Text] [Cited by in Crossref: 29] [Cited by in RCA: 31] [Article Influence: 1.6] [Reference Citation Analysis (0)] |
| 16. | Bayouth JE, Morrill SM. MLC dosimetric characteristics for small field and IMRT applications. Med Phys. 2003;30:2545-2552. [RCA] [PubMed] [DOI] [Full Text] [Cited by in Crossref: 34] [Cited by in RCA: 37] [Article Influence: 1.8] [Reference Citation Analysis (0)] |
| 17. | Grigorov G, Foster K, Chow JCL, Osei E. Prostate IMRT: Two-dimensional model of rectal NTCP employing the variability of rectal motion and rectum wall thickness. Int J Rad Res. 2014;12:283-293. |
| 18. | Marks RJ. 1991 Introduction to Shannon Sampling and Interpolation Theory. New York: Springer 1991; . [DOI] [Full Text] |


