Copyright
©2012 Baishideng Publishing Group Co.
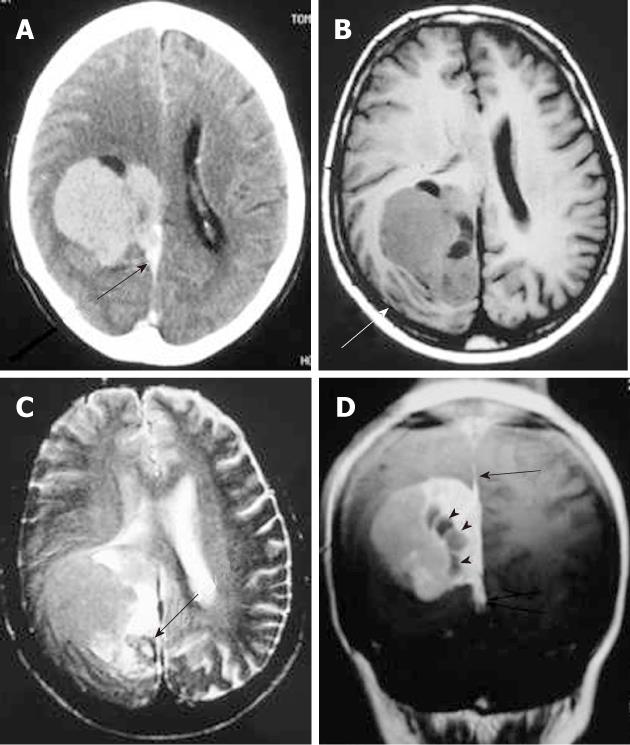
Figure 1 Solitary fibrous tumor.
Post-contrast computed tomography. A: A dural-based lobulated mass with dural tail enhancement (arrow); B: Axial T1-weighted magnetic resonance (MR) image shows an extra-axial mass, isointense to the gray matter compressing the adjacent cortical convolutions (arrow); C: Axial T2-weighted MR image shows that the mass has intermediate signal intensity. Note the peritumoral cysts with high signal intensity (arrow); D: On the post-contrast, T1-weighted MR image, the mass shows intense enhancement, intra-tumoral cysts (arrowheads) and dural tail sign (arrow).
- Citation: Chourmouzi D, Potsi S, Moumtzouoglou A, Papadopoulou E, Drevelegas K, Zaraboukas T, Drevelegas A. Dural lesions mimicking meningiomas: A pictorial essay. World J Radiol 2012; 4(3): 75-82
- URL: https://www.wjgnet.com/1949-8470/full/v4/i3/75.htm
- DOI: https://dx.doi.org/10.4329/wjr.v4.i3.75


