Copyright
©The Author(s) 2017.
World J Radiol. Sep 28, 2017; 9(9): 350-358
Published online Sep 28, 2017. doi: 10.4329/wjr.v9.i9.350
Published online Sep 28, 2017. doi: 10.4329/wjr.v9.i9.350
Figure 1 Flowchart showing inclusion and exclusion criteria for selection of cases for sector-based analysis.
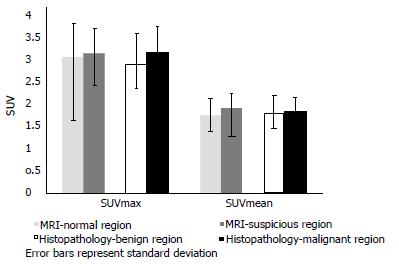
Figure 2 Sectorial analysis comparing 18F-labelled fluorodeoxyglucose uptake in sectors found to be suspicious on magnetic resonance imaging or malignant on histopathology with 18F-labelled fluorodeoxyglucose uptake in the remaining sectors.
Mean values and standard deviations have been shown.
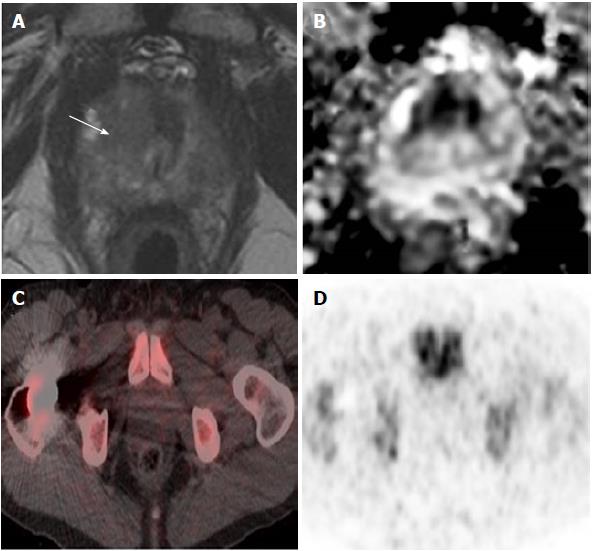
Figure 3 High-grade prostate cancer showing no increased uptake on positron emission tomography/computed tomography in a 73-year-old man.
A, B: Prostate MRI performed for raised PSA (19 ng/mL) showed a high probability lesion in the right apex transition zone (arrow in A) with matching restricted diffusion on the ADC map (B). Subsequent targeted transperineal biopsy confirmed Gleason 4 + 5 disease in 40% of cores; C, D: PET/CT performed after a two-month interval and no intervening treatment showed no focal uptake in this region shown as both fused PET/CT imaging (C) and PET alone (D). PET/CT: Positron emission tomography/computed tomography; MRI: Magnetic resonance imaging; ADC: Apparent diffusion co-efficient; PSA: Prostate specific antigen.
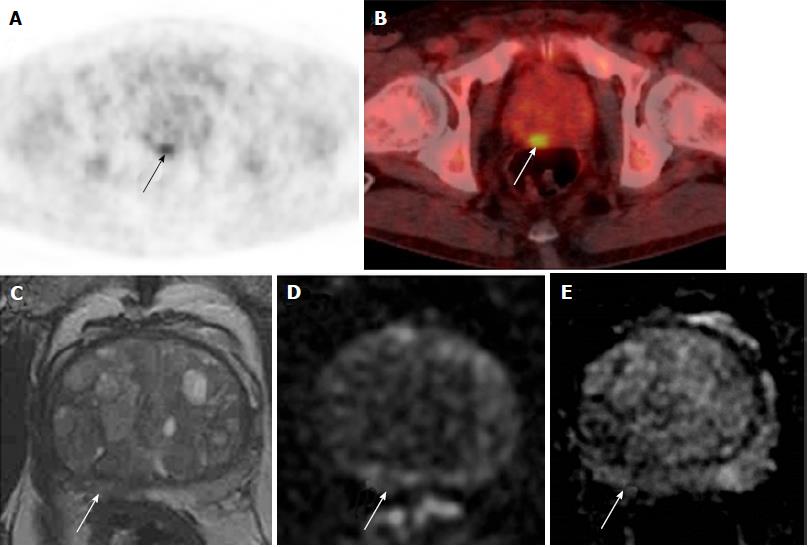
Figure 4 Incidental prostatic 18F-labelled fluorodeoxyglucose uptake in a 67-year-old patient with Stage IV diffuse large B-cell lymphoma.
A, B: Focal uptake in the posterior right peripheral zone of the prostate at the level of the mid-gland as demonstrated on PET (A) and fused PET/CT (B); SUVmax = 4.5; C-E: Prostate MRI shows non-specific geographical intermediate signal on T2-weighted imaging (C), but with no matching restricted diffusion on b-1400 diffusion-weighted images (D) or ADC maps (E). The MRI findings are low probability for tumour. Subsequent transrectal ultrasound-guided biopsy showed no cancer. PET/CT: Positron emission tomography/computed tomography; MRI: Magnetic resonance imaging; ADC: Apparent diffusion co-efficient.
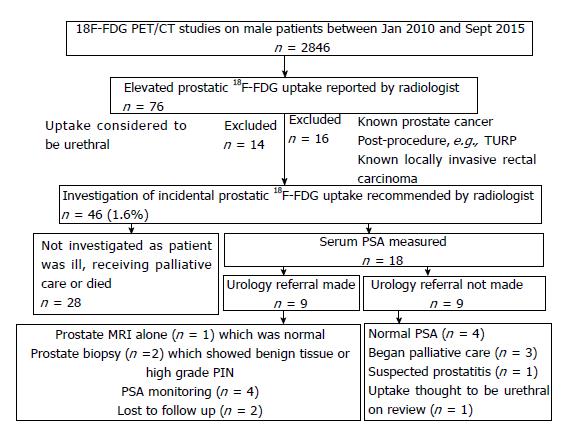
Figure 5 Flowchart showing clinical outcomes in patients with elevated prostatic 18F-labelled fluorodeoxyglucose uptake.
Figure 6 Midline uptake on 18F-labelled fluorodeoxyglucose positron emission tomography/computed tomography in a 71-year-old man with oesophageal carcinoma and serum prostate specific antigen of 4.
58 ng/mL. A, B: Fused PET/CT and PET-only imaging shows focal uptake in the midline of the prostate (arrowed). The uptake was considered to be tracer in the urethra given its anatomical location. PET/CT: Positron emission tomography/computed tomography.
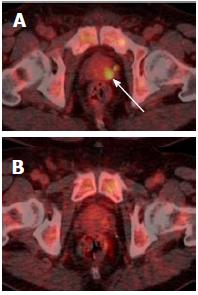
Figure 7 Resolving focal prostatic uptake in a 61-year-old man with Stage IV high-grade non-Hodgkin’s lymphoma and serum prostate-specific antigen of 2.
85 ng/mL. A: Fused PET/CT imaging performed after 2 cycles of chemotherapy shows focal uptake (arrowed) in the left side of the prostate at the level of the midgland on fused PET/CT; B: Repeat PET/CT performed 4 mo later following completing of 6 cycles of chemotherapy demonstrates resolution of this focal uptake. PET/CT: Positron emission tomography/computed tomography.
- Citation: Chetan MR, Barrett T, Gallagher FA. Clinical significance of prostate 18F-labelled fluorodeoxyglucose uptake on positron emission tomography/computed tomography: A five-year review. World J Radiol 2017; 9(9): 350-358
- URL: https://www.wjgnet.com/1949-8470/full/v9/i9/350.htm
- DOI: https://dx.doi.org/10.4329/wjr.v9.i9.350


