Copyright
©The Author(s) 2017.
World J Radiol. Apr 28, 2017; 9(4): 178-190
Published online Apr 28, 2017. doi: 10.4329/wjr.v9.i4.178
Published online Apr 28, 2017. doi: 10.4329/wjr.v9.i4.178
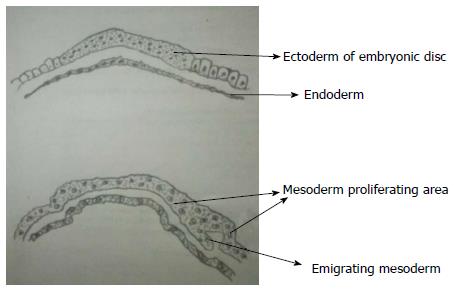
Figure 1 Gastrulation.
During gastrulation, the bilaminar embryonic disc is converted to a trilaminar disc by the formation of mesoderm. There is rapid division of cells in embryonic disc which then detach and migrate between endoderm and ectoderm to form mesoderm. Notochord later develops from mesoderm.
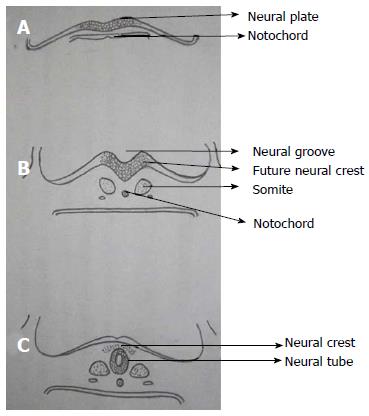
Figure 2 Primary neurulation.
A: Thickening of embryonic ectoderm is seen dorsal to notochord to form neuroectoderm and neural plate; B: Neural plate invaginates along its central axis to form neural groove. Neural folds are formed on both sides of the neural groove; C: The neural plate then bends and neural folds fuse together to form neural tube and simultaneously separate from surface ectoderm (dysjunction).
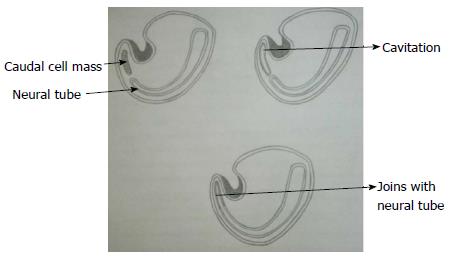
Figure 3 Secondary neurulation.
Schematic diagram of caudal end of embryo showing secondary neurulation which forms the distal part of spinal cord. There is formation of solid caudal cell mass distal to the caudal neuropore which then develops a lumen by a process called “cavitation”. This then becomes continuous with the central cavity of neural tube.
Figure 4 Open and closed spinal dysraphism.
Clinical pictures of open (A) and closed (B) spinal dysraphism. In open spinal dysraphism, a case of cervical myelomeningocele the neural placode is directly exposed to the environment and is surrounded by partially epithelized skin (arrow in A). In closed spinal dysraphism with subcutaneous mass there is continuous skin coverage over the abnormality (arrow in B).
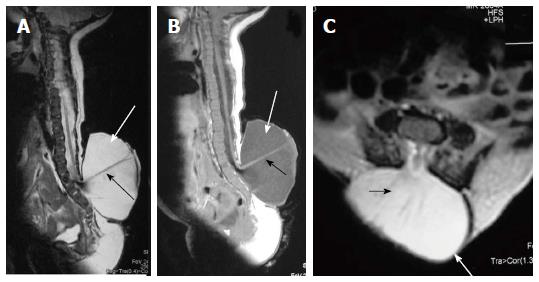
Figure 5 Lumbar myelomeningocele.
T2 weighted sagittal (A), T1 weighted sagittal (B) and T2 weighted axial (C) images of lumbar spine showing myelomeningocele. There is posterior herniation of a CSF filled sac (white arrows) containing cord and nerve fibers (black arrows). There is absence of skin covering with interruption of subcutaneous fat.
Figure 6 Myelocele.
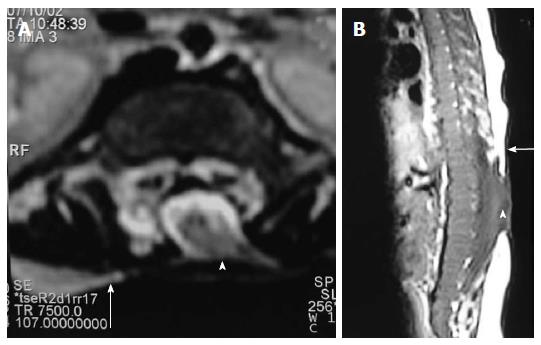
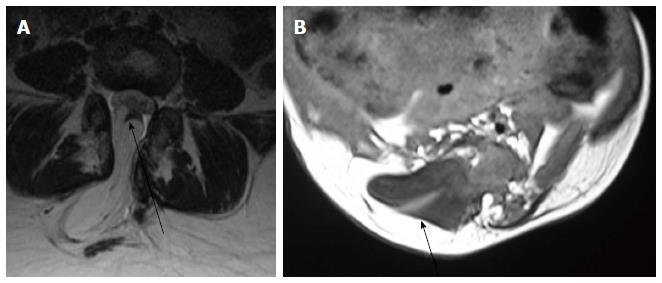
Axial T2 weighted (A) and sagittal T1 weighted (B) images of dorsolumbar spine in a case of myelocele showing the neural placode (arrowhead) flush with the skin surface (arrow). Skin covering is absent over the myelocele.
Figure 7 Myelocele and myelomeningocele.
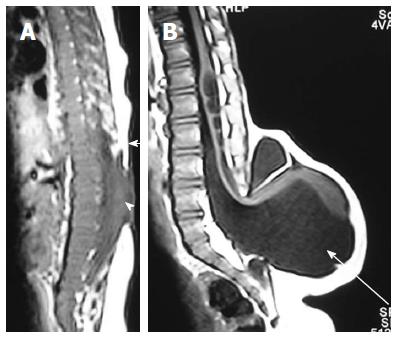
Sagittal T1 weighted images of spine in cases of myelocele (A) and myelomeningocele (B). In myelocele the placode (arrowhead) is flush with the skin surface (arrow). In myelomeningocele (B), the protruding neural placode extends beyond the skin surface as there is enlargement of the underlying subarachnoid space (arrow).
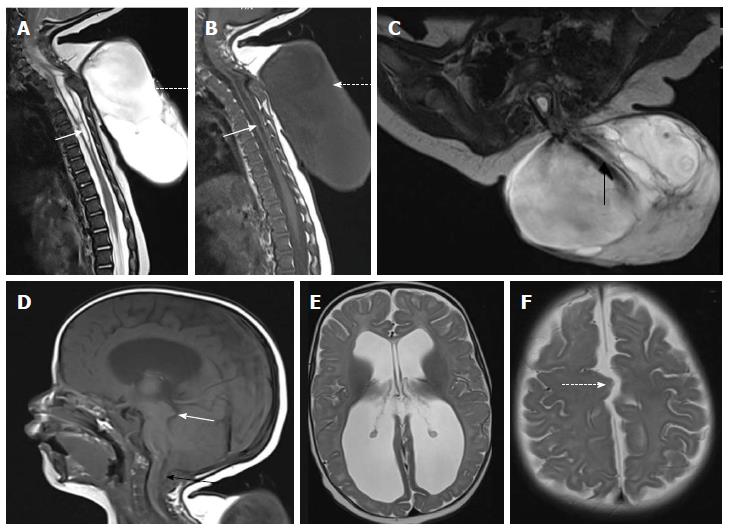
Figure 8 Cervico-dorsal myelomeningocele with Chiari II malformation.
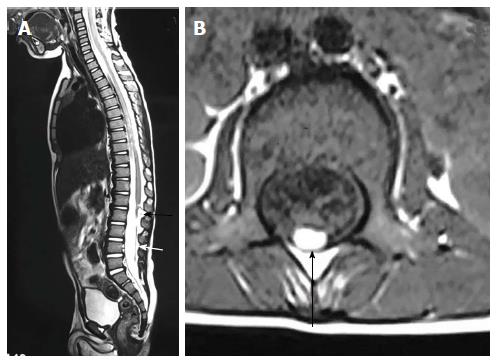
T2 weighted sagittal (A), T1 weighted sagittal (B) and T2 weighted axial (C) images of cervicodorsal spine showing myelomeningocele. There is posterior herniation of a CSF filled sac (dashed arrows) containing nerve fibers (black arrow). Spinal cord show kinking at the same level and dilated central canal (white arrow) suggestive of syringohydromyelia. There is no overlying skin cover. Sagittal T1 weighted (D) and axial T2 weighted (E and F) images of brain shows herniation of cerebellar tonsils (black arrow) with tectal beaking (white arrow). Fourth ventricle is elongated and tubular shaped. There is colpocephaly suggestive of corpus callosal agenesis (in E) and interdigitating gyri (dashed arrow in F) suggestive of fenestrated falx.
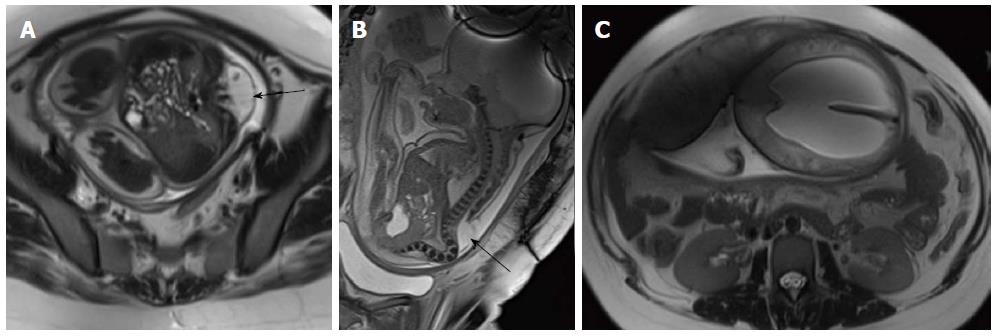
Figure 9 Fetal Myelomeningocele with Chiari II malformation.
Axial (A) and sagittal (B) T2 weighted images of lumbar spine of fetus showing splaying of posterior elements of lumbar vertebrae with herniation of spinal canal contents (black arrow) suggestive of MMC. Axial T2 weighted image of brain (C) shows associated hydrocephalus. Hydrocephalus in the setting of MMC in a fetus is considered highly suggestive of Chiari II malformation. MMC: Myelomeningocele.
Figure 10 Lipoma placode interface in lipomyelocele and lipomyelomeningocele.
Axial T2 weighted images in cases of lipomyelocele (A) and axial T1 weighted images in case of lipomyelomeningocele (B) showing high intensity fat on the dorsal aspect of the neural placode which is continuous with the adjacent subcutaneous fat. The lipoma placode interface (black arrow) is within the spinal canal in lipomyelocele and outside the spinal canal in lipomyelomeningocele. Both these conditions have intact skin covering.
Figure 11 Lipomyelocele.
T2 weighted sagittal (A), T1 weighted sagittal (B) and T2 weighted axial (C) images of lumbosacral spine in a case of lumbar lipomyelocele. High intensity fat is seen on the dorsal aspect of the neural placode which is continuous with the adjacent subcutaneous fat (arrowhead) through an open defect in the posterior aspect of spinal canal. The placode lipoma interface is within the spinal canal (arrow).
Figure 12 Hemilipomyelomeningocele.
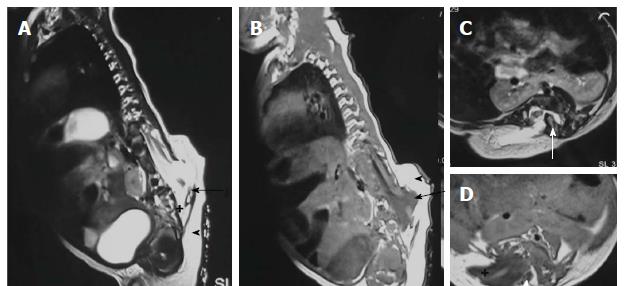
T2 weighted sagittal (A), T1 weighted sagittal (B), T2 weighted axial (C) and T1 weighted axial (D) images in a case of hemilipomyelomeningocele. There is diastematomyelia with bony septum (white arrow) suggestive of type I diastematomyelia. There is defect in the posterior spinal canal on the right side through which the spinal canal contents herniate with intact overlying skin and subcutaneous tissue (arrowhead). There is expansion of subarachnoid space (+) anterior to the cord pushing the neural placode - lipoma interface posteriorly to lie outside the boundaries of spinal canal (arrow).
Figure 13 Posterior meningocele with persistent terminal ventricle.
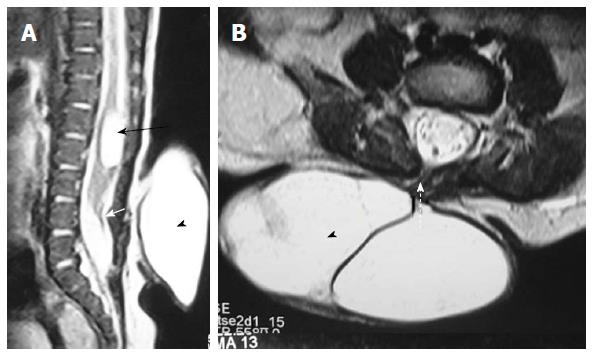
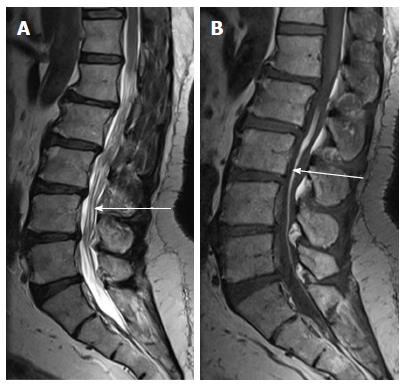
T2 weighted sagittal (A) and axial (B) images of lumbosacral spine showing posterior meningocele and persistent terminal ventricle. There is herniation of a CSF filled sac (arrowhead) through a posterior spina bifida (dashed arrow) consistent with posterior meningocele. No neural tissue is noted within the CSF sac. There is another CSF attenuation lesion in conus medullaris (black arrow) suggestive of persistent terminal ventricle. The filum terminale is short and thick (white arrow) with low lying spinal cord suggestive of tight filum terminale. CSF: Cerebrospinal fluid.
Figure 14 Dural lipoma.
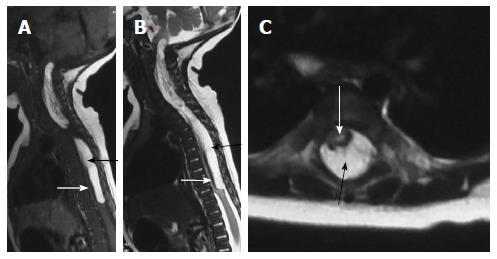
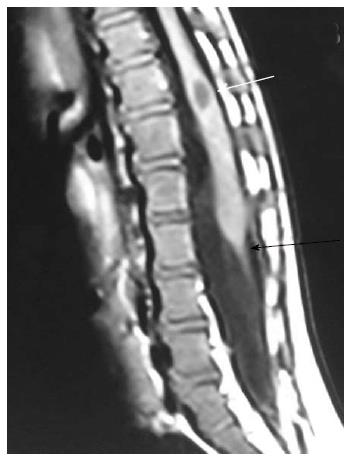
T2 weighted sagittal (A), T1 weighted sagittal (B) and T2 weighted axial (C) images of cervico-dorsal spine showing a T1 and T2 hyperintense lesion in the spinal canal (black arrow) causing compression and anterior displacement of the spinal cord (white arrow). The lesion is isointense to subcutaneous fat on all sequences.
Figure 15 Filarlipoma.
T2 weighted sagittal (A) and T1 weighted axial images of lumbosacral spine in a case of filar lipoma. The lesion (black arrow) appears hyperintense on both T1 and T2 weighted images and follows the signal of subcutaneous fat on all sequences. Filum terminale is thickenined and is tethered (white arrow).
Figure 16 Fat in filumterminale.
T2 weighted (A) and T1 weighted (B) sagittal images of lumbosacral spine in a 60-year-old male showing linear T1 and T2 hyperintense focus in filumterminale (arrow) noted incidentally. Spinal cord is not low lying and there is no tethering of cauda equina fibres. Note is made of degenerative changes in lumbar spine.
Figure 17 Tight filumterminale.
T1 weighted sagittal image of the lumbosacral spine showing thick and short filum terminale (black arrow) with low lying spinal cord. There is a CSF attenuation lesion in conus medullaris (white arrow) suggestive of syrinx. CSF: Cerebrospinal fluid.
Figure 18 Dermal sinus.
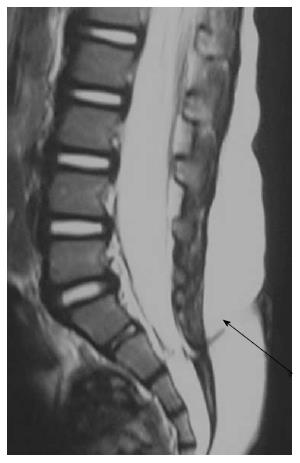
T2 weighted sagittal images of lumbosacral spine showing a T2 hypointense tract extending from the posterior skin surface to the spinal canal (black arrow). There is associated tethered cord.
Figure 19 Infected dermal sinus with intraspinal dermoid.
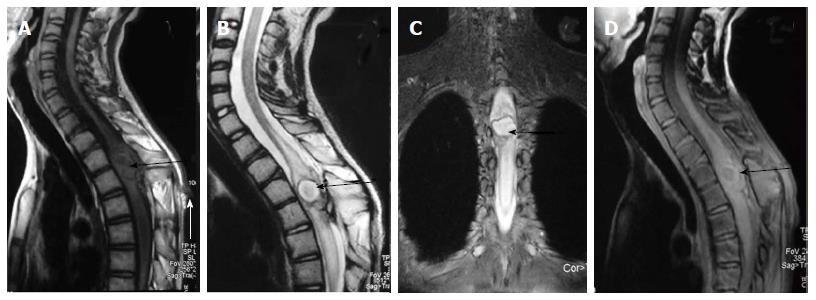
T1 weighted sagittal image (A) showing a dermal sinus (white arrow) with an intraspinal lesion (black arrow) showing mildly hyperintense signal with expansion of spinal cord. On T2 weighted sagittal (B) and STIR coronal (C) images the intraspinal lesion appears hyperintense with well defined hypointense rim. On post contrast image (D) there is peripheral enhancement of the intraspinal lesion and the tract.
Figure 20 Neuroenteric cyst.
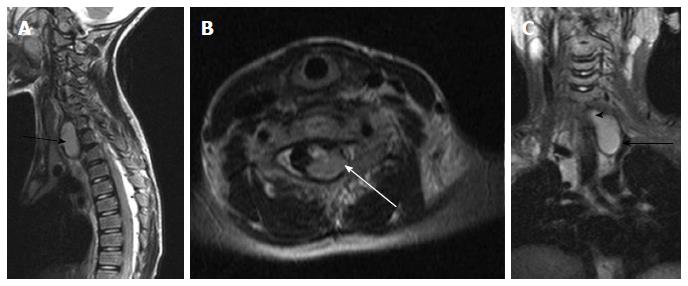
T2 weighted images of cervicodorsal spine in sagittal (A), axial (B) and coronal (C) planes show a bilobed lesion with both extraspinal (black arrow) and intraspinal extramedullary component (white arrow). The communication between them (arrowhead) is better appreciated in the coronal plane (C).
Figure 21 Diastematomyelia II.
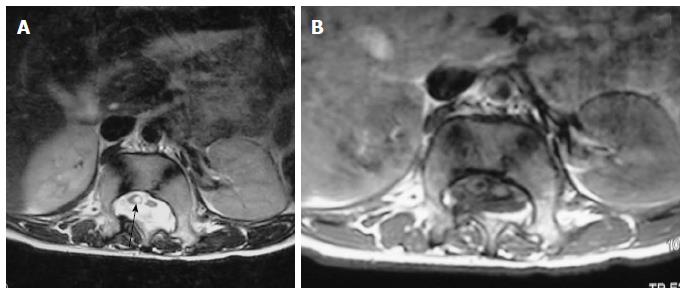
Axial T2 weighted (A) and T1 weighted (B) scan of lumbar spine showing two hemicords. No intervening bony septum was noted. The hemicord on the right shows dilated central canal or syringohydromyelia (arrow).
Figure 22 Caudal agenesis.
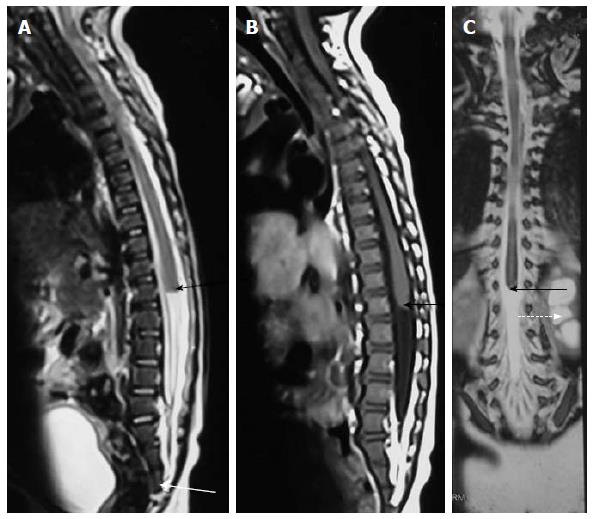
T2 weighted sagittal (A), T1 weighted sagittal (B) and T2 weighted coronal (C) MR images showing type II caudal agenesis. There is non-development of distal sacral vertebra (white arrow in A) with abnormal termination of conus medullaris (black arrow). The child also has associated left hydronephrosis (dashed arrow in C).
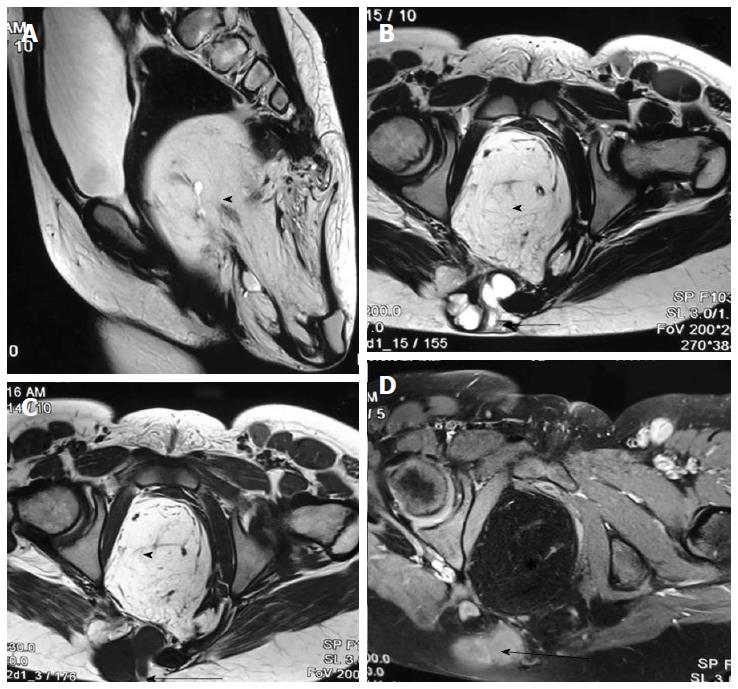
Figure 23 Sacrococcygeal teratoma (type III).
T2 weighted sagittal (A), T2 weighted axial (B), T1 weighted axial (C) and T1 weighted fat suppressed axial post contrast (D) images show a large heterogeneous presacral lesion. It has a large internal component which is predominately fat (arrowhead) appearing hyperintense on both T1 and T2 weighted images with signal suppression on post contrast fat saturated image. It also has a small complex solid cystic external component (arrow) appearing hyperintense on T2 wighted and hypointense on T1 weighted with enhancement on post contrast images.
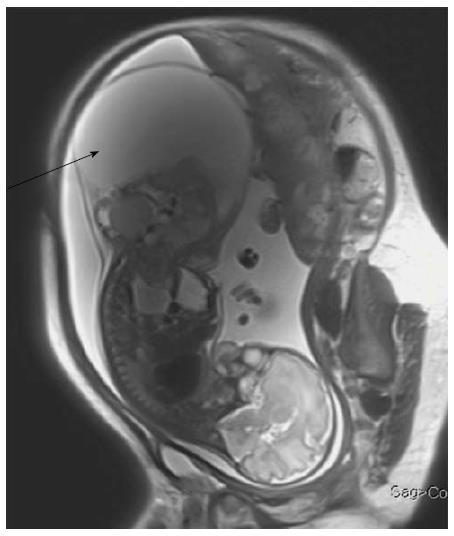
Figure 24 Fetal sacrococcygeal teratoma.
T2 weighted sagittal scans through the fetus show a large heterogeneous lesion in the lumbosacral region (arrow) with extension into the pelvis. The lesion shows both solid and cystic components consistent with sacrococcygeal teratoma.
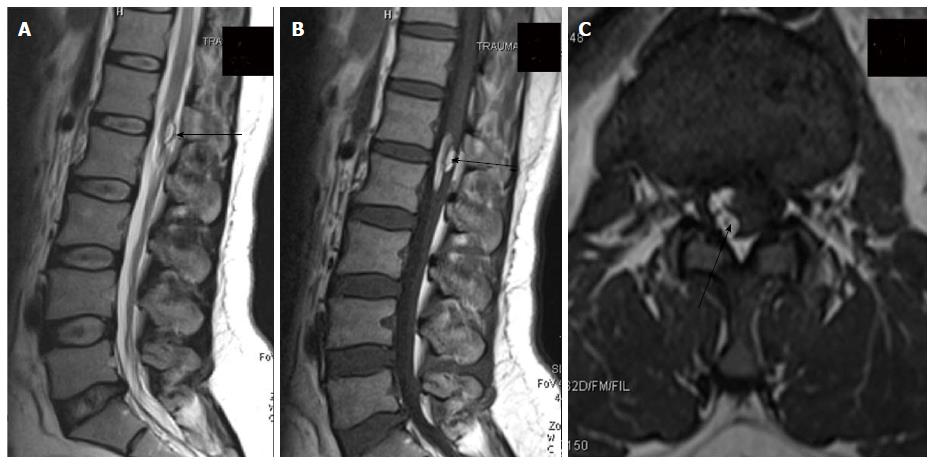
Figure 25 Post-operative dermoid.
In a post-operative case of spinal dyraphysm, T2 weighted sagittal, T1 weighted sagittal and T1 weighted axial images of lumbosacral spine showing a T1 and T2 hyperintense lesion in the conusmedullaris and filumterminale consistent with dermoid formation (black arrow).
- Citation: Kumar J, Afsal M, Garg A. Imaging spectrum of spinal dysraphism on magnetic resonance: A pictorial review. World J Radiol 2017; 9(4): 178-190
- URL: https://www.wjgnet.com/1949-8470/full/v9/i4/178.htm
- DOI: https://dx.doi.org/10.4329/wjr.v9.i4.178


