Copyright
©The Author(s) 2016.
World J Radiol. Jun 28, 2016; 8(6): 588-593
Published online Jun 28, 2016. doi: 10.4329/wjr.v8.i6.588
Published online Jun 28, 2016. doi: 10.4329/wjr.v8.i6.588
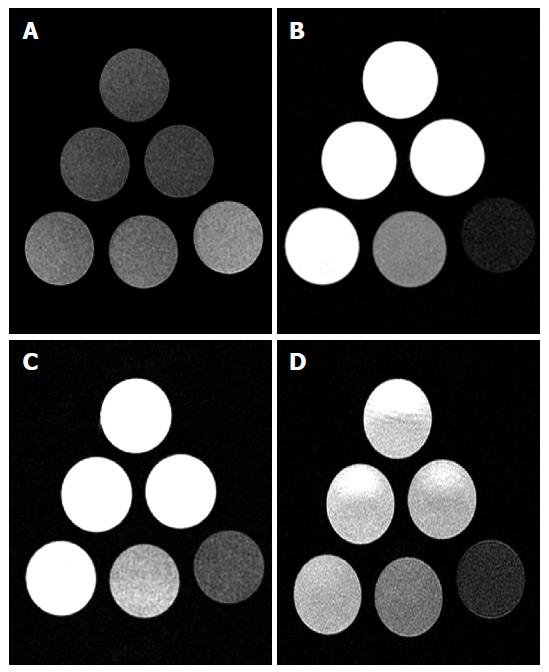
Figure 1 In vitro phantom magnetic resonance images at 3T.
T1-WI (A), T2-WI (B), gradient-echo (GRE) (C) and fluid-attenuation-inversion-recovery (FLAIR) (D) magnetic resonance images of various aliquots of Iopamidol. Distribution in the phantom as follow: Bottom right, undiluted 100% contrast media; Bottom middle, 50%; Bottom left, 25%; Mid-row right, 12.5%; Mid-row left, 6.25% and Top, physiologic saline. Note significant hypo intensity of the higher concentrations of iodinated contrast on T2-WI (B), yielding the highest contrast to noise ratios. Conspicuity on FLAIR, GRE and particularly on T1-WI (hyper intensity respect to saline) is reduced as compared with T2-WI.
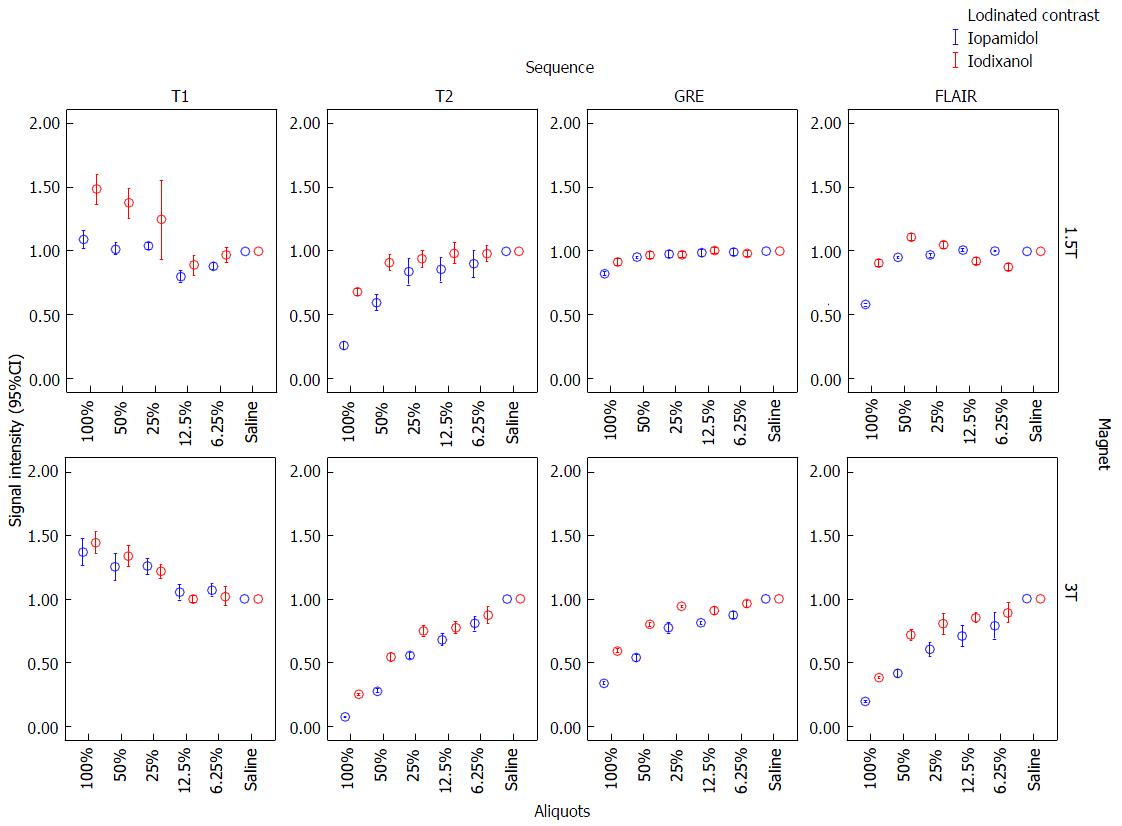
Figure 2 Error-bars graphic analysis of signal intensity for various sequences, magnetic fields and iodinated contrasts.
Note both iopamidol and iodixanol demonstrated increased SI on T1 and decreased SI on SE-T2, GRE and FLAIR at 1.5T and 3T, as the concentration of ICM mixed with saline was increased. Signal intensity = (SI-contrast/SI-saline). SI: Signal intensity; ICM: Iodinated contrast material; SE: Spin-echo; GRE: Gradient-echo; FLAIR: Fluid-attenuation-inversion-recovery.
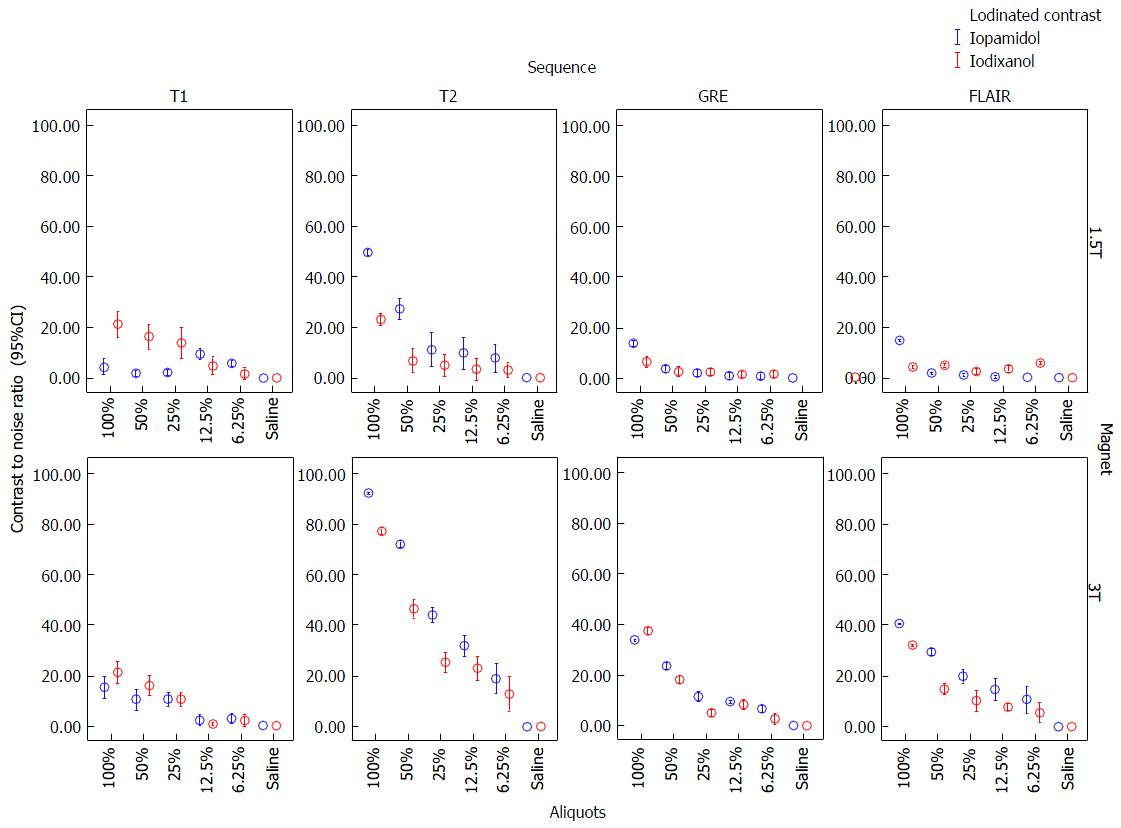
Figure 3 Error-bars graphic analysis of contrast to noise ratios for various sequences, magnetic fields and iodinated contrasts.
Note the highest contrast to noise ratios (CNR) on T2-WI in both magnetic fields and the increased CNR at 3T due to the expected increase in signal-to-noise ratio. Inconspicuity for detection would be expected on GRE sequences as demonstrate by low CNRs, particularly at 1.5T. The CNRs increased in all cases as concentration of contrast increases. GRE: Gradient-echo; FLAIR: Fluid-attenuation-inversion-recovery.
- Citation: Morales H, Lemen L, Samaratunga R, Nguyen P, Tomsick T. Effects of iodinated contrast on various magnetic resonance imaging sequences and field strength: Implications for characterization of hemorrhagic transformation in acute stroke therapy. World J Radiol 2016; 8(6): 588-593
- URL: https://www.wjgnet.com/1949-8470/full/v8/i6/588.htm
- DOI: https://dx.doi.org/10.4329/wjr.v8.i6.588


