Copyright
©The Author(s) 2015.
World J Radiol. Dec 28, 2015; 7(12): 448-458
Published online Dec 28, 2015. doi: 10.4329/wjr.v7.i12.448
Published online Dec 28, 2015. doi: 10.4329/wjr.v7.i12.448
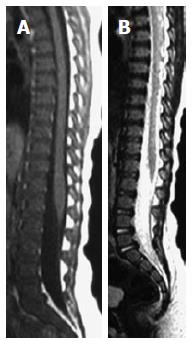
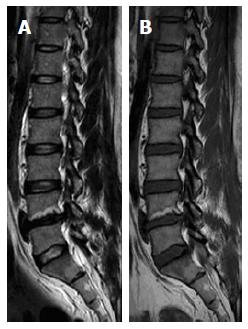
Figure 1 Sagittal T1W (A) and T2W (B) images of 2-year-old boy showing low-signal of the spinal marrow just barely brighter than intervertebral discs on T1W images due to richness in red marrow.
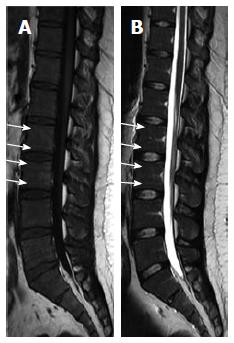
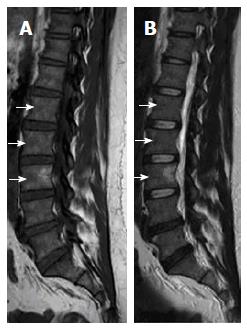
Figure 2 Sagittal T1W (A) and T2W (B) images of 25-year-old male showing linear high-signal of the normal fat marrow at the sub-endplate zones (white arrows) at LV2 through LV5 levels.
Note also, linear focal fat depositions along the basi-vertebral veins posteriorly.
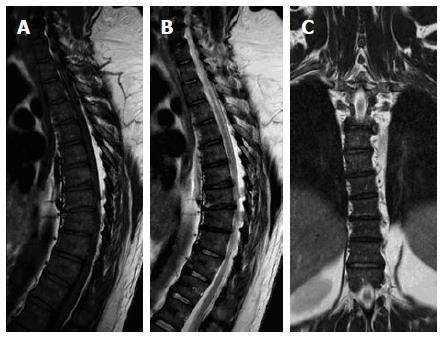
Figure 3 Sagittal T1W (A), T2W (B) and coronal STIR (C) images of the dorsal spines of a 60-year-old male with mild scoliotic deformity of the mid dorsal region.
The figure shows heterogeneous vertebral marrow with predominantly T1W high-signal and T2W intermediate signal meanwhile, the whole marrow did not exhibit abnormal signal on STIR images. STIR: Short tau inversion recovery.
Figure 4 Sagittal T1W (A) and T2W (B) images of 24-year-old male showing linear high-signal intensities along the course of basi-vertebral veins with near ending of normal marrow conversion into the mature/fat type.
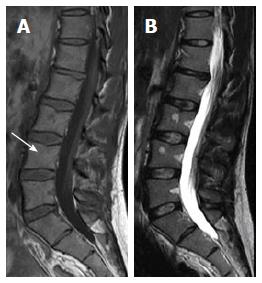
Figure 5 Sagittal T1W (A) and T2W (B) images of 53-year-old male showing LV4 lower end plate irregularities with subjacent Type-II Modic changes with high-T1W and T2W signal.
Note adjacent LV4-5 disc desiccations.
Figure 6 Sagittal T1W (A) and T2W (B) images of 41-year-old female showing LV3 patch of high-signal intensity (unchanged on serial magnetic resonance follow-up; not shown) on both T1W and T2W with fuzzy margins, proved to focal fatty metaplasia.
Note areas of low signal intensity under the anterior cortex of multiple adjacent vertebral bodies (short white arrows) corresponding to focal nodules of red marrow.
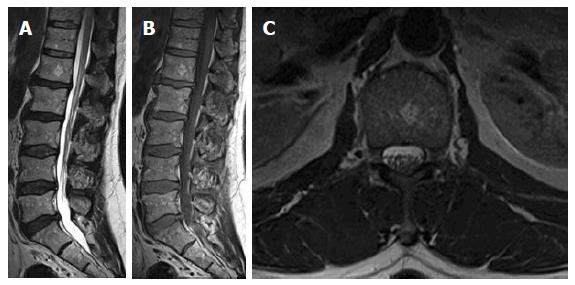
Figure 7 Sagittal T1W (A), T2W (B) and axial T2W images of 63-year-old osteoporotic female showing heterogeneous lumbar vertebral marrow signal with diffuse increased high-signal intensities due to higher fat content.
There is a focal round patch of increased signal on both T1 and T2 weighting in LV1 body with small punctuate areas of low signal intensities; seen unchanged from previous 2 magnetic resonance examinations (not shown here) confirmed to be a small typical vertebral hemangioma.
Figure 8 Sagittal T1W (A), T2W (B) and STIR (C) images of 65-year-old female showing L1 vertebral body atypical hemangioma with diffuse low signal intensity on T1W image and high-signal intensity on T2W and STIR images presented on a background of lumbar spondylotic changes.
Note also, DV11 old porotic wedging. Companion imaging showed prominent trabecular pattern on focused radiography (D) and CT (E) of the LV1 with characteristic polka-dot sign. STIR: Short tau inversion recovery.
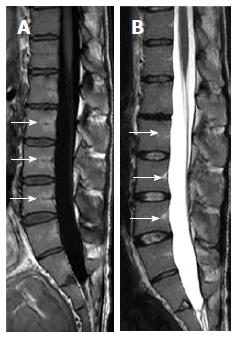
Figure 9 Sagittal T1W (A) and T2W (B) images of 33-year-old male showing focal geographic low signal intensity patches targeting LV3 and LV4 bodies centers as well as around basi-vertebral veins.
These patches still of high-signal intensity on T2W image. Note, the central fat spot (white arrow) and fuzzy margins of LV4 lesion inferring benignity features are consistent with focal nodular marrow reconversion.
- Citation: Nouh MR, Eid AF. Magnetic resonance imaging of the spinal marrow: Basic understanding of the normal marrow pattern and its variant. World J Radiol 2015; 7(12): 448-458
- URL: https://www.wjgnet.com/1949-8470/full/v7/i12/448.htm
- DOI: https://dx.doi.org/10.4329/wjr.v7.i12.448


