Copyright
©2014 Baishideng Publishing Group Inc.
World J Radiol. Sep 28, 2014; 6(9): 636-642
Published online Sep 28, 2014. doi: 10.4329/wjr.v6.i9.636
Published online Sep 28, 2014. doi: 10.4329/wjr.v6.i9.636
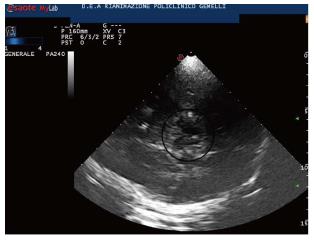
Figure 1 Midbrain transverse scan.
The butterfly-shaped mesencephalic brainstem surrounded by the echogenic basal cisterns is shown in the circle.
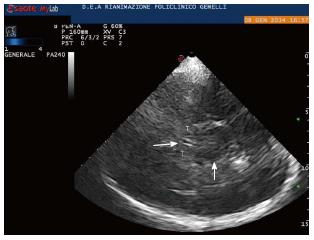
Figure 2 Diencephalic transverse scan.
The third ventricle can be visualized as a highly echogenic double-line image (arrow head on the left). Mesencephalon is indicated by the arrow head on the right. T: Thalamus.
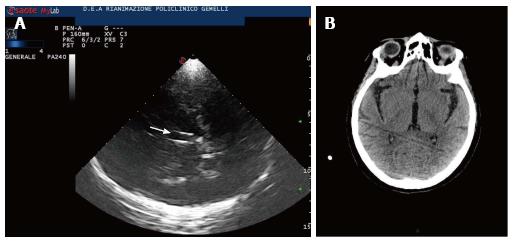
Figure 3 Third ventricle.
A: Diencephalic transverse scan. A small enlargement (12 mm) of third ventricle is shown (arrow); B: Third ventricle in computed tomography (CT). CT scan correspondent of Figure 3A is shown.
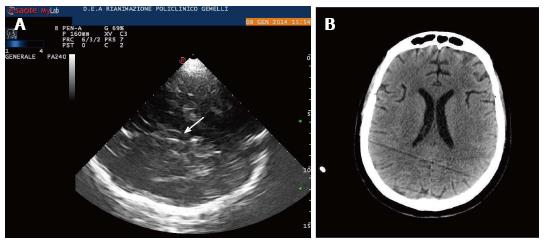
Figure 4 Lateral ventricles.
A: Lateral ventricles in echography. Frontal horns of lateral ventricles are visualized as hypoechogenic structure, well visible between two parallel lines corresponding to the medial and lateral layer of the ependima. The three parallel lines correspond to lateral layers of ependima and septum pellucidum. The image is generated by a sectorial probe, and lateral ventricle ipsilateral to the probe is depicted at the same depth of the third ventricle. Arrow shows third ventricle, Small arrow heads on the left show frontal horns of lateral ventricles; B: Lateral ventricles in computed tomography (CT). CT scan of lateral ventricles correspondent of Figure 4A is shown.
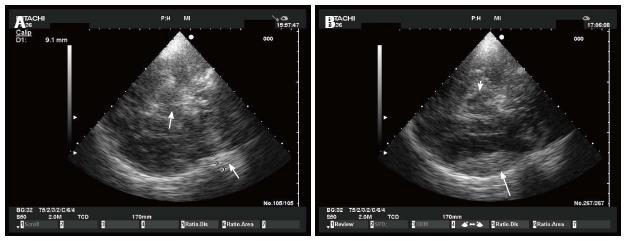
Figure 5 Epidural hematoma in echography.
A: Epidural hematoma. A small epidural hematoma (arrow on the right) is shown as an hyperechogenic image just inside the skull. Arrow on the left indicates mesencephalon; B: Epidural hematoma. The same epidural hematoma of Figure A (arrow) 1 h later. White arrow indicates mesencephalon.
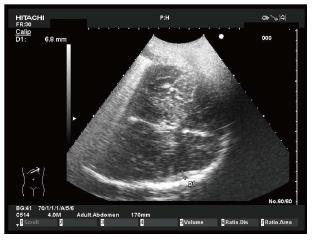
Figure 6 Epidural hematoma in decompressive craniectomy.
A small acute epidural hematoma is shown as a hyperechogenic mass lesion controlateral to decompressive craniectomy.
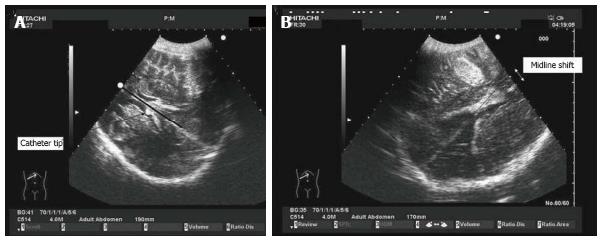
Figure 7 Midline shift in decompressive craniectomy.
Images obtained through decompressive craniectomy. Midline was identified with the interventricular line. The distance between the extension of falx and the interventricular line was measured as midline shift (MLS). In the case on the left (A), the extension of the falx exactly overlaps with the interventricular line (dark line). On the right (B), MLS caused by a temporal hematoma is shown.
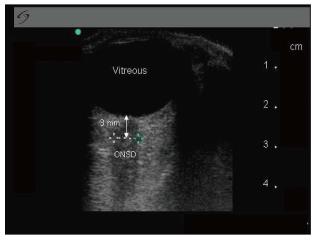
Figure 8 Optic nerve sheath diameter.
Using a 7.5-MHz linear probe on the closed upper eyelid, the optic nerve was visualized as a linear hypoechoic structure with clearly defined margins posterior to the globe. Sheath diameter was measured 3 mm behind the globe. ONSD: Optic nerve sheath diameter.
- Citation: Caricato A, Pitoni S, Montini L, Bocci MG, Annetta P, Antonelli M. Echography in brain imaging in intensive care unit: State of the art. World J Radiol 2014; 6(9): 636-642
- URL: https://www.wjgnet.com/1949-8470/full/v6/i9/636.htm
- DOI: https://dx.doi.org/10.4329/wjr.v6.i9.636


