Copyright
©2014 Baishideng Publishing Group Inc.
World J Radiol. Aug 28, 2014; 6(8): 530-537
Published online Aug 28, 2014. doi: 10.4329/wjr.v6.i8.530
Published online Aug 28, 2014. doi: 10.4329/wjr.v6.i8.530
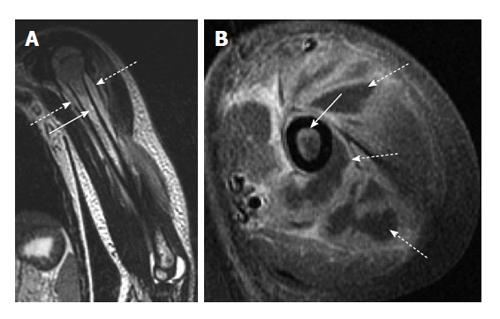
Figure 1 Acute osteomyelitis secondary to methicillin-resistant Staphylococcus aureus infection.
A: Coronal T2-weighted image of the left humerus shows bone marrow edema (solid arrow) as well as a periosteal fluid collection (dashed arrow) consistent with periosteal abscess; B: Axial T1-weighted post-contrast image shows both enhancement of the bone marrow (solid arrow) as well as extensive periosteal and soft tissue abscess formation (dashed arrows) which is characteristic of methicillin-resistant Staphylococcus aureus infection.
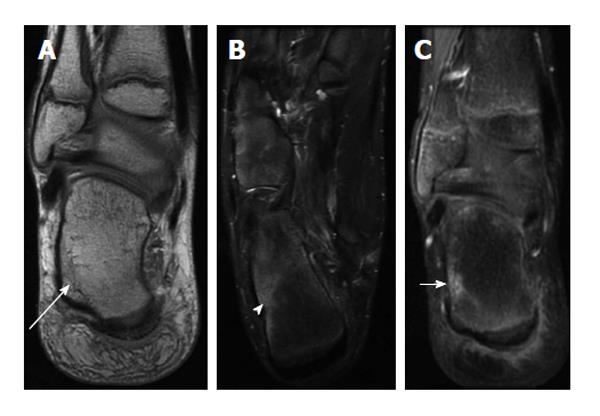
Figure 2 Early acute osteomyelitis.
A: Coronal proton-density weighted image of the right ankle of a 12-year-old male shows a subtle area of decreased intramedullary signal along the lateral aspect of the calcaneus (long arrow); B: Axial T2-weighted image with fat suppression demonstrates more conspicuous bone marrow edema (arrowhead); C: Coronal post-contrast T1-weighted image with fat suppression shows an area of enhancement corresponding to the bone marrow edema. Bone biopsy revealed bacterial osteomyelitis.
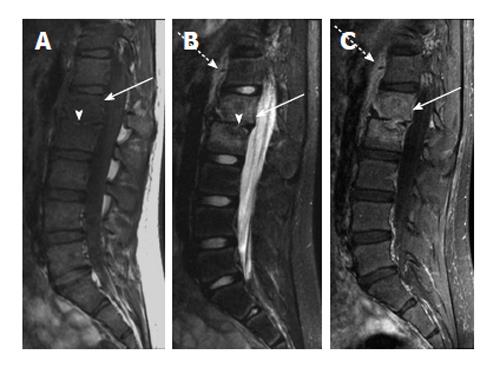
Figure 3 Chronic vertebral diskitis-osteomyelitis secondary to S.
typhi. A: Sagittal T1-weighted image shows abnormally decreased T1 marrow signal in the L1 and L2 vertebral bodies (arrow) and loss of the L1-2 disk space (arrowhead); B: Sagittal T2-weighted image with fat suppression shows abnormally increased T2 signal in the L1 and L2 vertebral bodies (solid arrow) with loss of normal T2 intervertebral disk signal (arrowhead). T2 hyperintensity anterior to the spine (dashed arrow) likely represents adjacent soft tissue edema; C: Sagittal T1-weighted image after intravenous contrast shows intramedullary enhancement in the L1 and L2 vertebral bodies (solid arrow) with soft tissue enhancement anterior to the spine (dashed arrow).
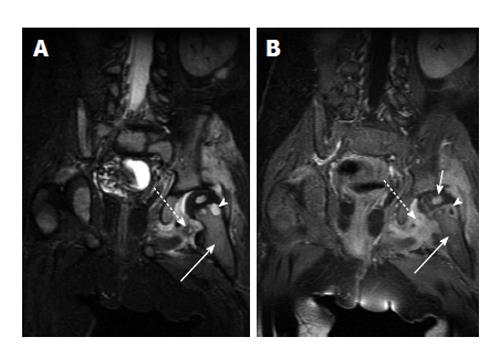
Figure 4 Acute osteomyelitis of the hip.
A: Coronal fast spin echo inversion recovery image shows T2-hyperintense marrow edema in the left femoral metaphysis (solid arrow) with a small round very intense focus of T2 signal (arrowhead) which is consistent with an intraosseous abscess. Surrounding soft tissue edema (dashed arrow) is also noted; B: Coronal T1-weighted post-contrast image in the same patient shows enhancement in the metaphyseal bone marrow (solid long arrow), peripheral enhancement of the abscess (arrowhead), and surrounding soft tissue enhancement (dashed arrow). Note enhancement of the left femoral head (solid short arrow) which indicates adequate perfusion.
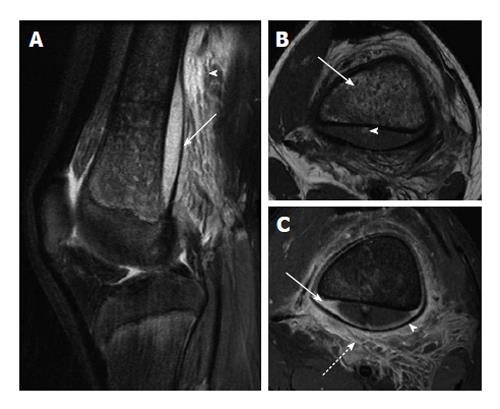
Figure 5 Osteomyelitis with subperiosteal abscess.
A: Sagittal T2-weighted image with fat suppression shows a large subperiosteal abscess (solid arrow) with adjacent soft tissue edema (arrowhead); B: Axial T1-weighted image shows heterogeneous T1 hypointense marrow signal (solid arrow). Note small T1 hyperintense focus in the posterior subperiosteal fluid collection (arrowhead) indicative of a fat globule; C: Axial T1-weighted post-contrast image demonstrates peripheral enhancement of the subperiosteal abscess (solid arrow), significant periosteal elevation (arrowhead) and adjacent soft tissue inflammation (dashed arrow).
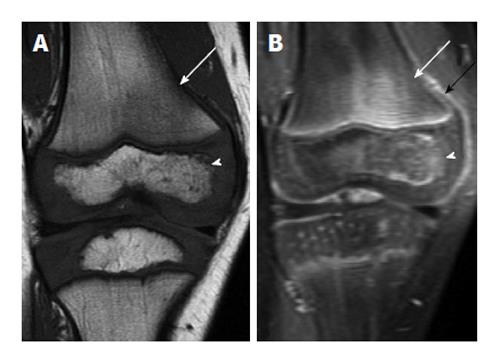
Figure 6 Early acute osteomyelitis.
A: Coronal T1-weighted image of the right knee of a 4-year-old male shows ill-defined areas of low T1 signal in the bone marrow in the lateral femoral metaphysis (arrow) and lateral epiphysis (arrowhead); B: Coronal T1-weighted post-contrast image in the same patient shows associated enhancement in these areas (white arrow and arrowhead) as well as some periosteal reaction, indicated by periosteal enhancement (black arrow).
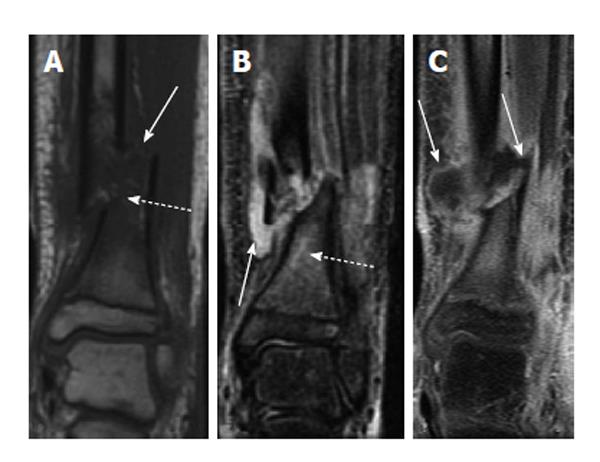
Figure 7 Osteomyelitis secondary to open fracture.
A: Coronal T1-weighted image of the left distal tibia shows a displaced fracture of the distal tibial metadiaphysis (solid arrow) with associated bone marrow edema (dashed arrow); B: Coronal T2-weighted image of the same patient shows a fluid collection adjacent to the fracture (solid arrow) with T2 hyperintense marrow edema (dashed arrow); C: Coronal T1-weighted post-contrast image shows peripheral enhancement surrounding the above-mentioned fluid collection, consistent with an abscess (solid arrows).
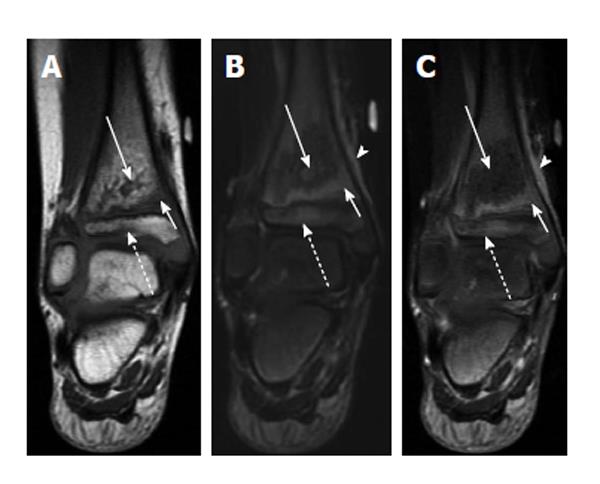
Figure 8 Transphyseal methicillin-resistant Staphylococcus aureus osteomyelitis with intraosseous abscess.
A: Coronal T1-weighted image of the right ankle shows an area of T1 hyperintensity in the distal tibial metaphysis with central T1 hypointensity (solid long arrow) indicative of abscess formation. T1 hypointensity is seen surrounding this area in metaphysis (solid short arrow) and in the epiphysis (dashed arrow) indicative of transphyseal spread; B: Coronal T2-weighted image with fat suppression shows an area of T2 hypointensity with central T2 hyperintensity (solid long arrow) corresponding to the areas of abnormal T1 signal in A. T2 hyperintensity in the distal metaphysis (solid short arrow) and epiphysis (dashed arrow) are consistent with edema. T2 hyperintensity in periosteum and adjacent soft tissues indicating inflammation (arrowhead); C: Coronal T1-weighted image post contrast shows a lack of enhancement in the central distal metaphysis consistent with necrosis and abscess formation (solid long arrow). Enhancement is seen peripherally in the distal metaphysis and epiphysis (solid short arrow and dashed arrow). Enhancement in periosteum and adjacent soft tissues indicating inflammation (arrowhead).
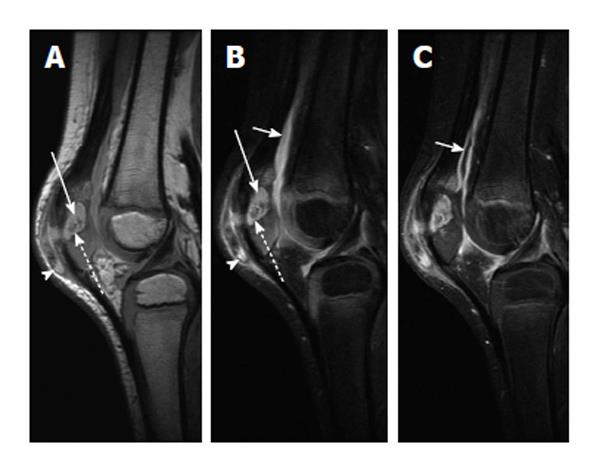
Figure 9 Chronic patellar osteomyelitis with abscess and sequestrum.
A: Sagittal proton-density-weighted image of the right knee shows an abscess cavity in the patella (solid arrow) with a central low-density focus consistent with a sequestrum (dashed arrow). There is also disruption of the anterior cortex with spread of infection into the prepatellar bursa (arrowhead); B: Sagittal T2-weighted image with fat suppression again shows the intraosseous abscess (solid long arrow) with central T2 hypointense sequestrum (dashed arrow) and extension of infection into the prepatellar soft tissues (arrowhead). A knee joint effusion is more apparent on this image (solid short arrow); C: Sagittal T1-weighted post-contrast image shows enhancement of the synovium (solid short arrow) indicative synovitis, likely from intra-articular extension of infection.
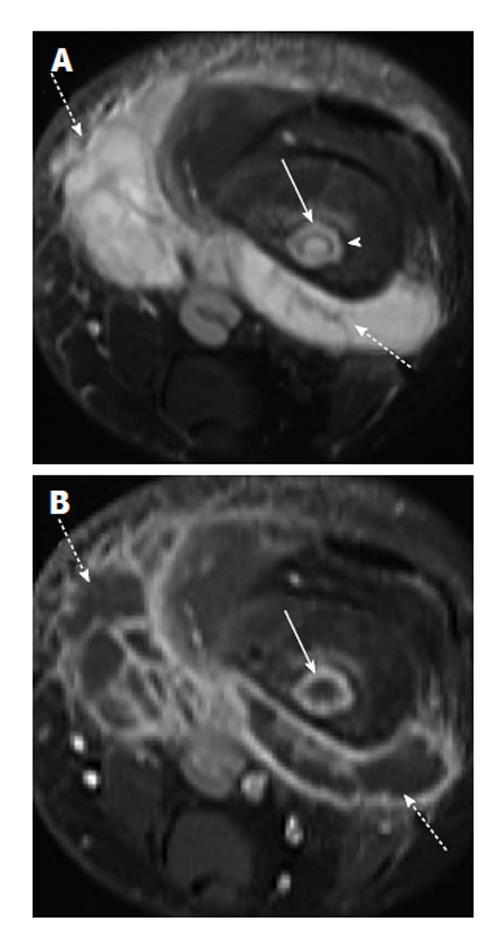
Figure 10 Osteomyelitis with intraosseous and soft tissue abscess secondary to methicillin-resistant Staphylococcus aureus infection.
A: Axial T2-weighted fat suppressed image shows intraosseous abscess cavity (solid arrow) with rim of surrounding edema and large surrounding soft tissue fluid collection (dashed arrow). Note T2 hypointense rim (arrowhead) forming the “double-line” sign; B: Axial T1-weighted post-contrast image shows peripheral enhancement associated with the intraosseous abscess (solid arrow) and soft tissue abscesses (dashed arrows).
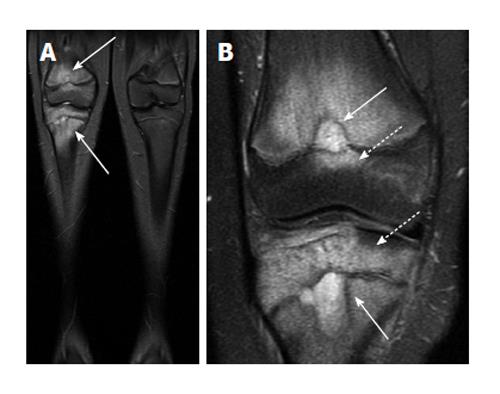
Figure 11 Chronic recurrent multifocal osteomyelitis.
A: Coronal short-tau inversion recovery image from whole body magnetic resonance imaging (lower extremity station) shows areas of bone marrow edema in the distal femur and proximal tibia; B: Coronal T2-weighted fat suppressed image with smaller field of view again demonstrates the bone marrow edema as well as two areas of very hyperintense T2 signal in the femur and tibia which may represent intraosseous abscesses (solid arrows), though these are not typically found in chronic multifocal recurrent osteomyelitis. Involvement of the epiphysis is apparent at both sites (dashed arrows).
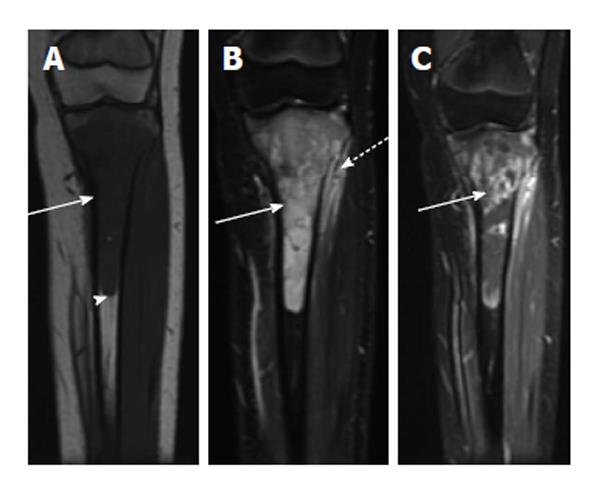
Figure 12 Ewing sarcoma.
A: Coronal T1-weighted image of the left tibia shows a long segment of intramedullary T1 hypointensity (solid arrow). Note abrupt transition to normal marrow signal inferiorly (arrowhead); B: Coronal fast multi-planar inversion recovery image of the same patient shows very intense T2 signal in the marrow cavity (solid arrow) with extraosseous extension (dashed arrow); C: T1-weighted post-contrast image shows very heterogeneous intramedullary enhancement associated with this lesion (solid arrow).
Figure 13 Langerhans cell histiocytosis.
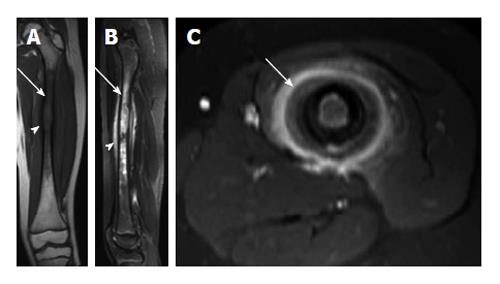
A: Coronal T1-weighted image of the left femur shows a long segment of marrow T1 hypointensity (arrow) and cortical erosion/expansion (arrowhead); B: Sagittal short-tau inversion recovery image from the same patient shows very intense T2-signal in the marrow cavity (arrow). T2 hyperintensity in the periosteum (arrowhead) is indicative of periosteal reaction; C: Axial T1-weighted image post contrast shows intense enhancement of the periosteum (arrow).
- Citation: Pugmire BS, Shailam R, Gee MS. Role of MRI in the diagnosis and treatment of osteomyelitis in pediatric patients. World J Radiol 2014; 6(8): 530-537
- URL: https://www.wjgnet.com/1949-8470/full/v6/i8/530.htm
- DOI: https://dx.doi.org/10.4329/wjr.v6.i8.530


