Copyright
©2014 Baishideng Publishing Group Inc.
World J Radiol. Jun 28, 2014; 6(6): 313-328
Published online Jun 28, 2014. doi: 10.4329/wjr.v6.i6.313
Published online Jun 28, 2014. doi: 10.4329/wjr.v6.i6.313
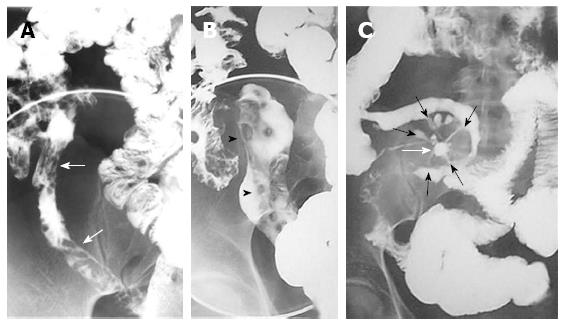
Figure 1 Barium studies in patients with Crohn’s disease.
Double-contrast barium enema examination (A and B) demonstrate longitudinal (arrows) and perpendicular (arrowheads) ulcerations in the terminal ileum. Small-bowel follow-through (C) demonstrates an abscess cavity (white arrow) with fistulae connecting the cavity to the adjacent small bowel (black arrows).
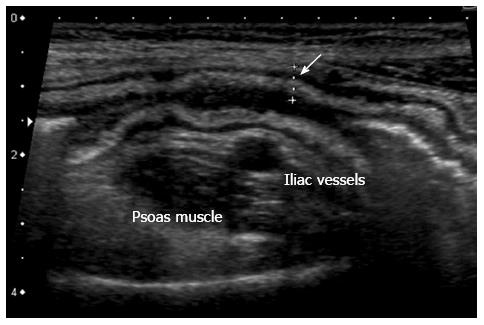
Figure 2 Thickening of the bowel wall, 5 mm, (arrow) with wall layers preserved.
The hyperechoic band corresponds to thickened submucosa.
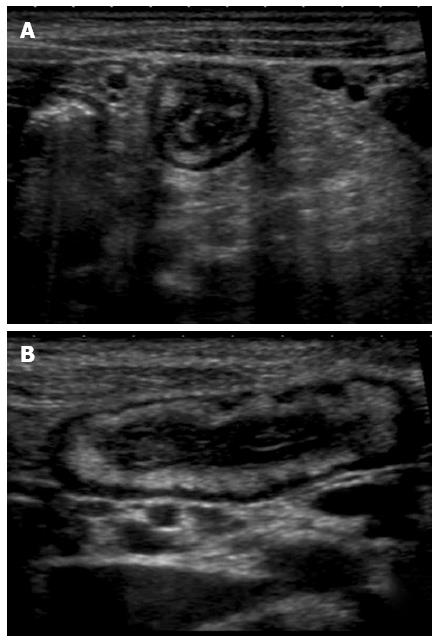
Figure 3 Transversal (A) and longitudinal (B) section of a thickened ileal loop due to Crohn’s disease.
The “target” sign, corresponding to remarkable bowel wall thickness, is visible as a strong echogenic centre surrounded by a hypoechoic border (A). The adjacent mesentery is thickened and hyperechoic, due to the transmural nature of inflammation in Crohn’s disease (A and B).
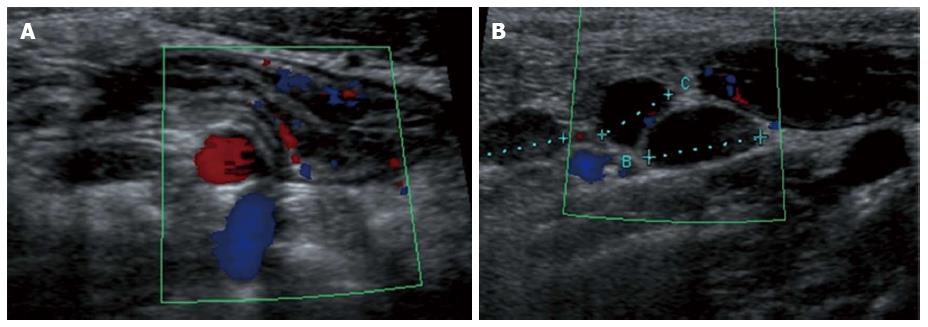
Figure 4 Longitudinal view of the terminal ileum in a 13-year-old boy with active Crohn’s disease.
The bowel wall is thickened and shows increase in Color Doppler signals denoting inflammatory hyperemia (A). Note in (B) the fibrofatty proliferation of the surrounding mesentery which appears hyperechoic and the enlarged mesenteric lymph-nodes.
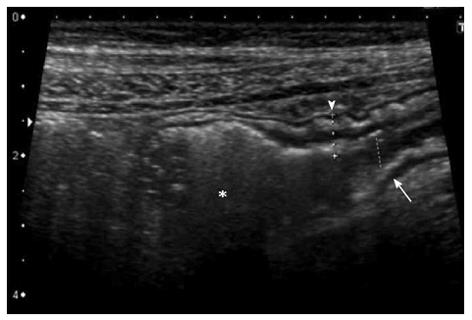
Figure 5 Longitudinal section of a distal ileal loop showing stiffness, mural thickening (arrowhead), lumen narrowing (arrow) and mild dilatation of the pre-stenotic segment (asterisk), suggesting a fibrotic nature of the stenosis.
Figure 6 The oral anechoic contrast solution, (polyethylene glycol), allows a better definition of lumen narrowing (arrow) and pre-stenotic dilatation (asterisk) as well as a more accurate measurement of the length of the stenosis.
Small intestine contrast ultrasonography also provides a dynamic assessment of the stenotic bowel loop: poor distensibility and presence of pre-stenotic dilatation suggest fibrosis, whereas normal distensibility and preserved peristalsis are features of inflammatory stenosis.
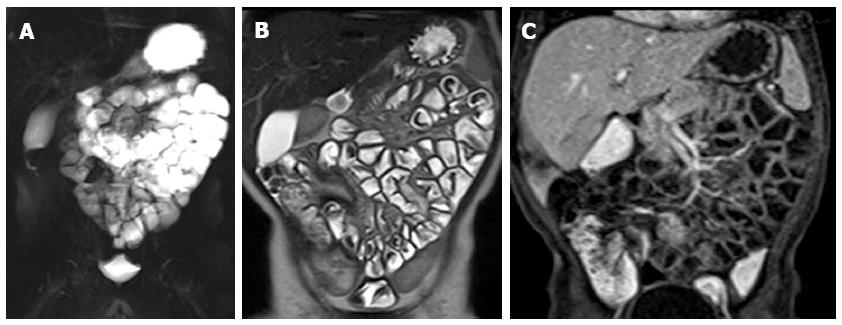
Figure 7 Magnetic resonance enteroclysis under anesthesia in one-year old male with Crohn’s disease at colonoscopy.
Coronal thick-slab HASTE image (A) shows good opacification of proximal and distal small bowel. The coronal T2-weighted (T2-w) image (B) and coronal fat-suppressed (FS) three-dimensional (3D) T1-weighted (T1-w) breath-hold gradient-echo (GE) image (C) are performed in free breathing.
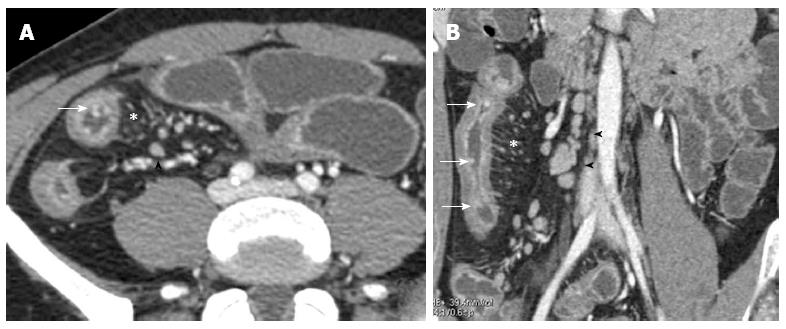
Figure 8 Transverse (A) and coronal (B) computed tomography show bowel wall thickening and mucosal hyper-enhancement with pseudo polyps (white arrows) as well as mesenteric lymph nodes, that are irregular in size and shape (black arrowhead) and increased mesenteric vascularity (asterisk).
These features may be detected in case of acute exacerbation on a background of longstanding disease.
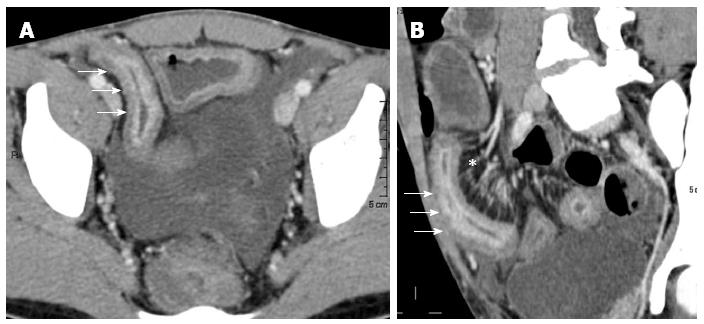
Figure 9 Transverse (A) and MRP sagittal (B) computed tomography show stratified enhancement of terminal ileum (arrows), and hyperemic mesentery with the “comb sign” (asterisk).
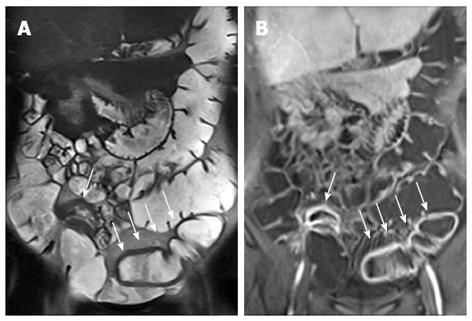
Figure 10 Transverse computed tomography (A) and post contrast T1-fat sat magnetic resonance imaging (B) images show a complex network between closely adherent small bowel loops appearing as a stellate configuration (arrows) due to entero-enteric fistulas.
Figure 11 Eighteen-years-old female with active Crohn’s disease and abscess.
Transverse T2-w (A), DWI (B), transverse (C) and coronal (D) post-contrast FS-T1-w image (C) show inflamed segments of the terminal ileum (arrowhead) with pericecal fluid-collection around ticked and hype-vascular walls (arrow), according to abscess. A small air bubble in the antideclive portion of the fluid collection is visible in the transverse T2-w (A) and transverse post-contrast FS-T1-w image (C).
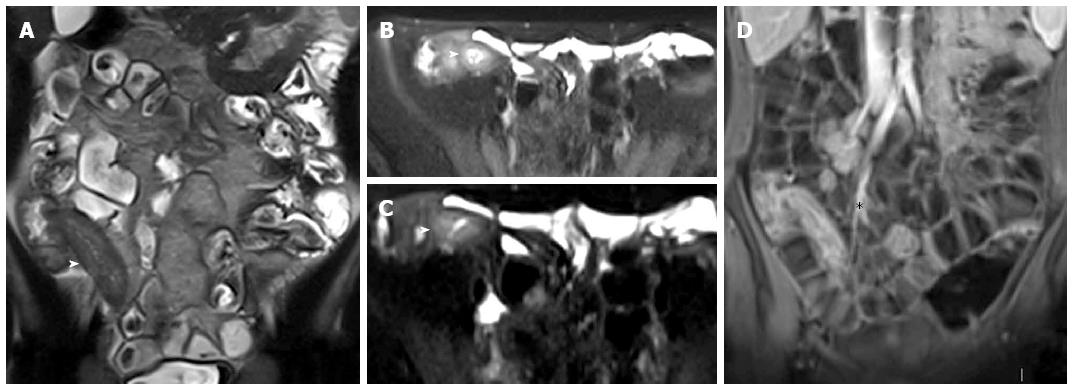
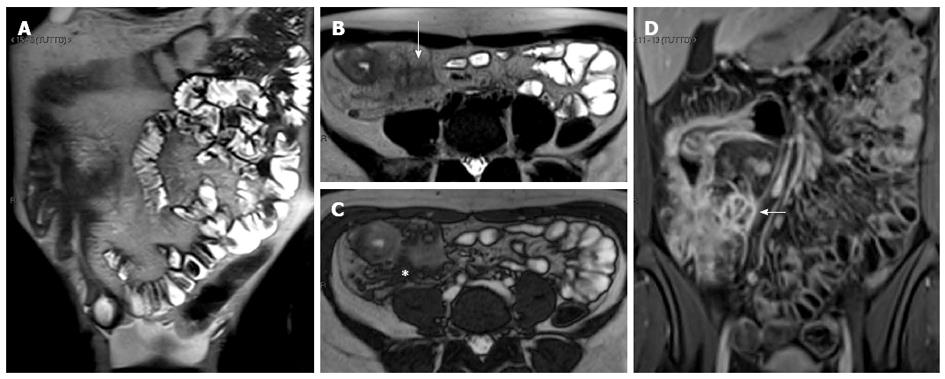
Figure 12 Thirteen years old male with active Crohn’s disease.
Coronal T2-weighted image (A), and transverse fat saturation T2-weighted images (B and C), show mural thickness and increased mural signal (arrowhead in B, C, and D) in the terminal ileum due to edema. Coronal post-contrast T1-weighted fat-suppressed image (D) at the same level shows mural stratification (asterisk).
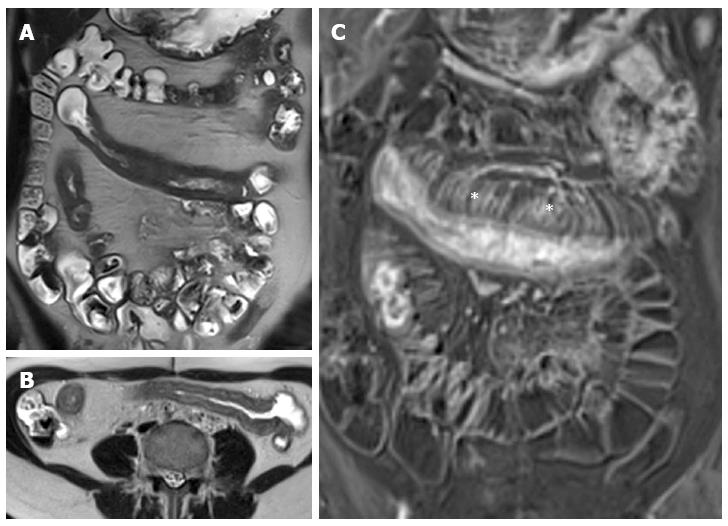
Figure 13 Thirteen years old female with active Crohn’s disease.
Coronal (A), transverse (B) T2-weighted images show thickened, inflamed segments of ileum and fat proliferating in the mesentery. The thin layer of high signal on T2 in b represents edema. The mass of the fat will displace adjacent small bowel. Coronal post-contrast T1-weighted fat-suppressed image (C) shows increased vascularity (asterisks), named “comb sign”, adjacent to a hyper-enhancing thickened segment of ileum.
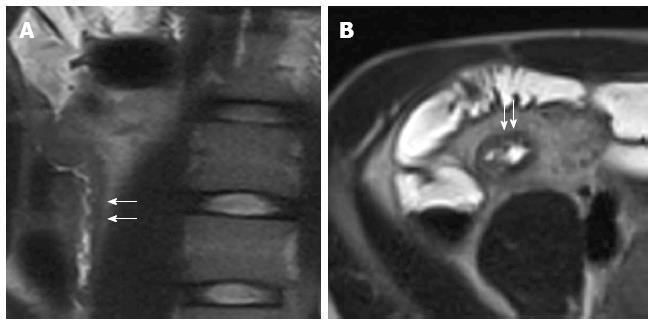
Figure 14 Coronal (A), transverse (B) T2-weighted images show thickened, inflamed segments of the terminal ileum with deep ulcers seen as high-contrast protrusions within bowel wall (arrows).
Figure 15 Twelve years old female with active disease and follow-up.
Transverse T2-weighted image (A) shows mural thickening (arrows) and increased mural signal (arrow) in the terminal ileum and coronal T1-weighted image (B) shows mural stratification (arrow), increased mesenteric vascularity adjacent to the inflamed bowel loop (the comb sign), and enlargement and hyper-enhancement of lymph-nodes (asterisk). In the same patient and at the same level, six months later after therapy, transverse T2-weighted image (C) shows the loss of increased mural signal (arrow) and coronal T1-weighted image (D) shows homogeneous enhancement without mural stratification (arrow), reduction of increased mesenteric vascularity adjacent to the inflamed bowel loop, and disappearance of lymp-nodes (asterisk).
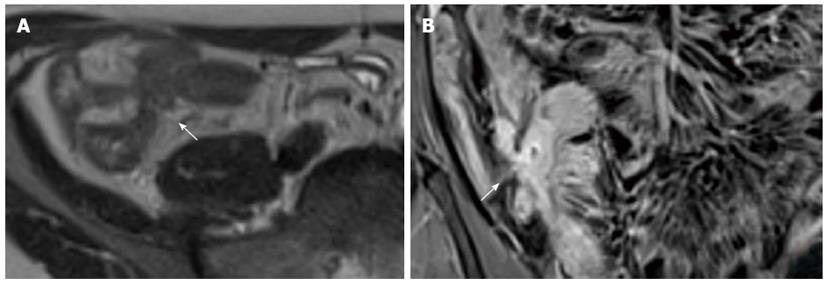
Figure 16 Transverse T2-w image (A) and coronal post-contrast FS-T1-w image (B) show cluster of bowel loops (arrow) interconnected by fistulas and adhesions.
Figure 17 Coronal (A) and transverse (B and C) CE FS-T1-w 3D gradient-echo image show a small abscess close to the terminal ileum (arrows).
Mural stratification and “comb sign” of the right colon flessure (black arrow), cecum (curved arrow), and appendix (white arrow) and homogeneous avid enhance of the terminal ileum (arrowhead). Enlargement and hyper-enhancement lymp-nodes (asterisk) are also visible.
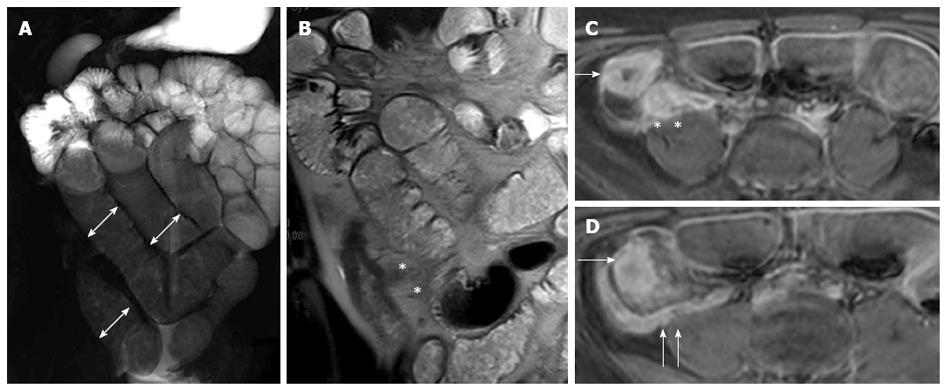
Figure 18 Fifteen years old male with small bowel obstruction caused by fibrotic stricture.
Thick-slab T2-w sequence (A) shows bowel dilatation greater than 3 cm (double arrows), according to functionally significant stricture. Coronal T2-w sequence (B) shows mural thickening of the terminal ileum without increased wall signal (asterisks). Transverse (C and D) CE FS-T1-w 3D GE show a homogeneous avidly enhancing of the cecum (arrow in C and D), terminal ileum (asterisks in C) and appendix (arrows in D). These findings can be finding in the small bowel obstruction due to fibrotic stricture.
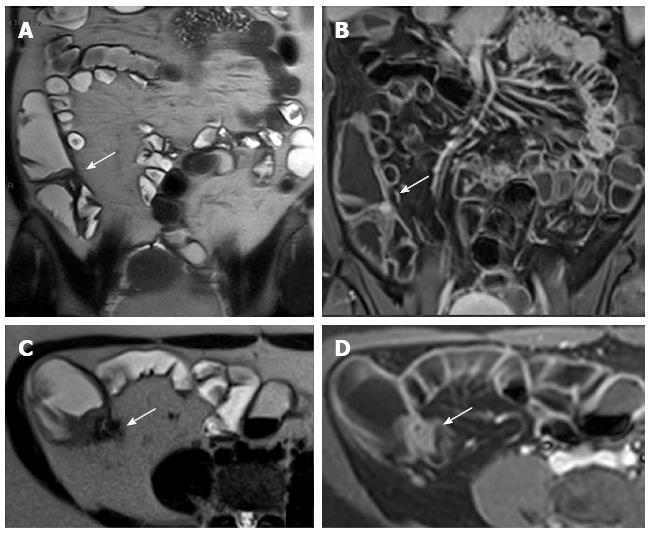
Figure 19 Eighteen-years-old female with long standing Crohn’s disease.
Coronal (A), transverse (B) T2-w images and coronal (C), transverse (D) post-contrast FS-T1-w images show thickening and hyper-enhancement of the ileocecal valve causing stricture.
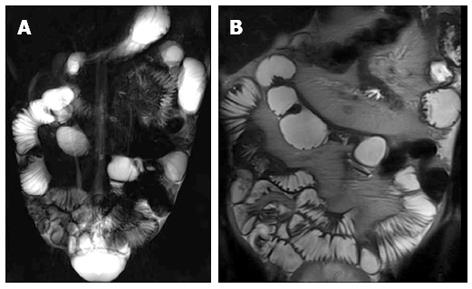
Figure 20 Coronal thick-slab HASTE (A) and coronal T2-weighted (B) images show pseudosacculations produced by asymmetric thickening of the ileal mesenteric border.
Figure 21 Colonic distention is optimized with a rectal enema.
Coronal T2-w (A) and post-contrast FS-T1-w (B) images show bowel wall thickening, and mural stratification of terminal ileum (arrow) and sigma (arrows) walls.
Figure 22 Twelve years old male with terminal ileum Crohn’s disease and perianal fistula.
Transverse T2-w (A) and post-contrast FS-T1-w (B) shows terminal ileum submucosa edema (black arrow) and mural stratification (arrows), respectively. Transverse FS-T2-w (C) image shows perianal fistula (arrowhead) in the same patient.
- Citation: Casciani E, Vincentiis CD, Polettini E, Masselli G, Nardo GD, Civitelli F, Cucchiara S, Gualdi GF. Imaging of the small bowel: Crohn’s disease in paediatric patients. World J Radiol 2014; 6(6): 313-328
- URL: https://www.wjgnet.com/1949-8470/full/v6/i6/313.htm
- DOI: https://dx.doi.org/10.4329/wjr.v6.i6.313


