Copyright
©2014 Baishideng Publishing Group Inc.
World J Radiol. Nov 28, 2014; 6(11): 865-873
Published online Nov 28, 2014. doi: 10.4329/wjr.v6.i11.865
Published online Nov 28, 2014. doi: 10.4329/wjr.v6.i11.865
Figure 1 Acute pyelonephritis in a 40 years old male.
A: US shows soft tissue in bilateral PCS (arrowhead) with increased echogenecity of perinephric fat (arrow); B: CECT nephrographic phase shows bilateral enlarged kidneys with heterogeneous enhancement. There is soft tissue thickening and abnormal enhancement of bilateral PCS and ureter (arrow); C: CECT delayed phase shows striated nephrogram (arrow) seen as linear bands of contrast extending from cortex to medulla. US: Ultrasonography; PCS: Pelvicalyceal system; CECT: Contrast-enhanced computed tomography.
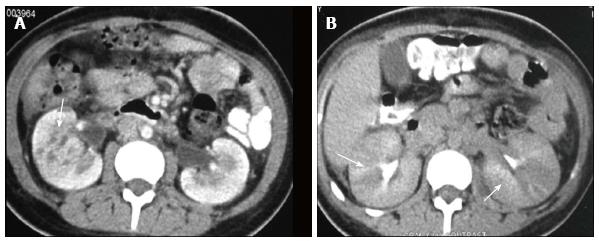
Figure 2 Acute pyelonephritis.
A: CECT venous phase shows heterogeneous parenchymal enhancement with pelvic wall thickening (arrow); B: CECT delayed phase shows alternating discrete rays of hyper and hypoattenuation (arrows) giving the appearance of a striated nephrogram. CECT: Contrast-enhanced computed tomography.
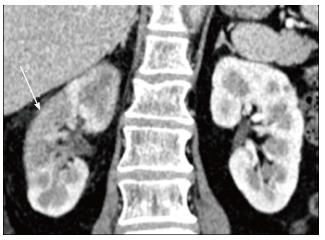
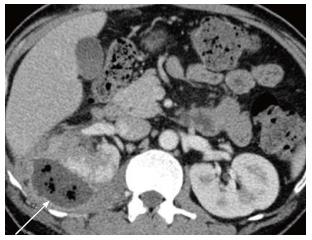
Figure 3 Contrast-enhanced computed tomography shows acute pyelonephritis manifesting as a focal wedge shaped hypodensity with surrounding fat stranding as seen in right kidney (arrow).
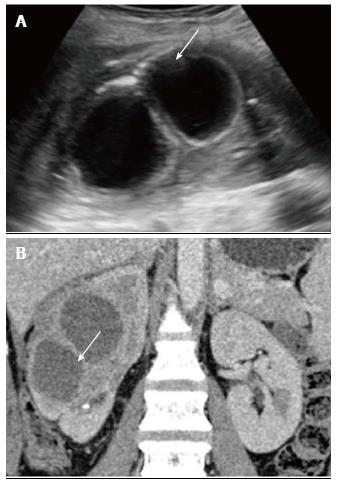
Figure 4 Mature abscess.
A: US shows a complex cystic lesion with thick walls in right kidney; B: CECT shows a sharply marginated area of low attenuation due to parenchymal necrosis with peripheral enhancing rim that suggest a mature abscess. US: Ultrasonography; CECT: Contrast-enhanced computed tomography.
Figure 5 Diffusion weighted magnetic resonance imaging.
A: CECT of a diabetic middle aged male shows multiple peripherally enhancing lesions in bilateral kidneys (arrows). B, C: DW-MRI (b = 1000) (B) and corresponding ADC maps (C) show that the lesions have restricted diffusion. Aspiration revealed the pyogenic nature of the abscess. There was excellent response to antibiotics. CECT: Contrast-enhanced computed tomography; DW-MRI: Diffusion weighted magnetic resonance imaging.
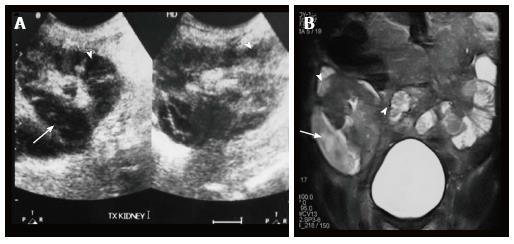
Figure 6 Acute pyelonephritis in transplant kidney.
A: USG of transplanted kidney in a 25 years old patient shows multiple hypoechoic lesions (arrowheads) within the cortex and one large hypoechoic lesion laterally (arrow); B: Coronal T2W MR shows multiple hyperintensities (arrowheads) in the renal cortex and a large well defined abscess (arrow) laterally suggestive of acute pyelonephritis with abscess formation.
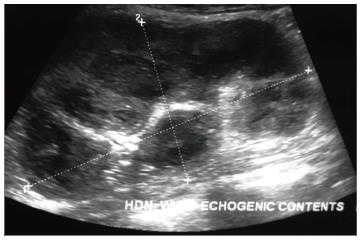
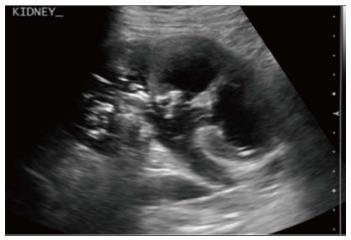
Figure 7 Ultrasonography shows hydronephrosis with echogenic debris within suggestive of pyonephrosis.
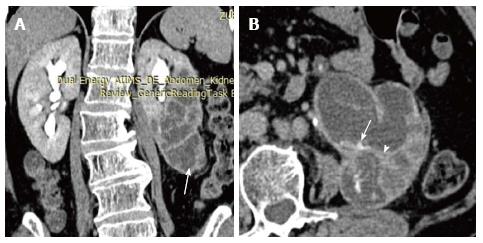
Figure 8 Pyonephrosis in duplex left kidney.
Coronal (A) and axial (B) sections of delayed phase CECT shows left duplex kidney with obstruction and hydronephrosis of lower moiety (arrow, A). Walls of the PCS shows thickening and crescentic enhancement (arrowhead, B) suggesting pyonephrosis. PCS: Pelvicalyceal system; CECT: Contrast-enhanced computed tomography.
Figure 9 Diffusion weighted magnetic resonance imaging at b = 1000 (A) and corresponding ADC map (B) show hydronephrosis with diffusion restriction suggestive of pyonephrosis (arrows).
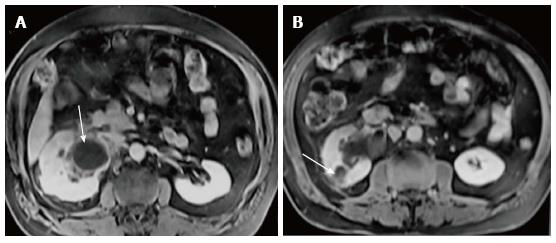
Figure 10 Axial sections of post gadolinium magnetic resonance imaging.
A 42 years old male with right hydronephrosis, peripheral enhancement of dilated pelvis (arrow, A) representing pyonephrosis along with a heterogeneously enhancing focal lesion in right kidney (arrow, B) suggestive of focal pyelonephritis.
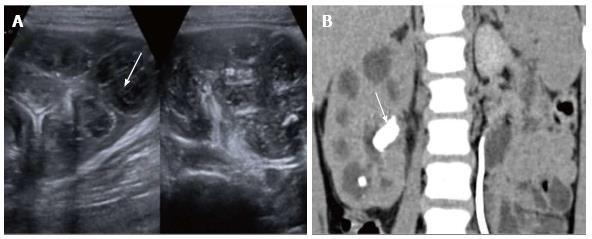
Figure 11 Xanthogranulomatous pyelonephritis.
A: USG shows enlarged kidney with parenchyma replaced with multiple hypoechoic masses (arrow, A) comprising inflammatory exudate; B: Computed tomography shows multiple low-attenuation rounded masses, corresponding to either dilated calyces or focal areas of parenchymal destruction with a central staghorn calculus (arrow, B).
Figure 12 Emphysematous pyelonephritis.
Ultrasonography shows dilated calyces with echoes within pelvis and renal parenchyma with dirty shadowing.
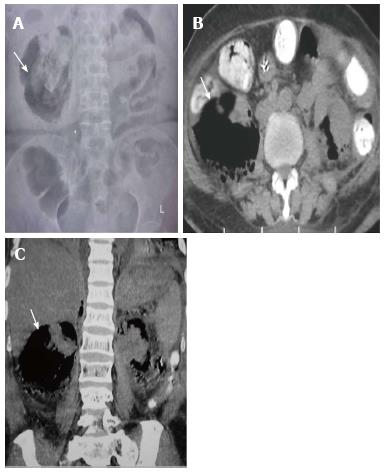
Figure 13 Type 1 emphysematous pyelonephritis.
A: Plain abdominal radiograph shows large amount of gas outlining the right kidney (arrow); B, C: Contrast-enhanced computed tomography axial (B) and coronal (C) images show gas pockets and parenchymal destruction destroying and replacing almost the entire right kidney. No perirenal collections are noted.
Figure 14 Type 2 Emphysematous pyelonephritis.
Contrast-enhanced computed tomography shows extensive inflammatory changes in right kidney and perinephric space with presence of gas within along with perirenal collection. The patient responded to antibiotics and percutaneous drainage.
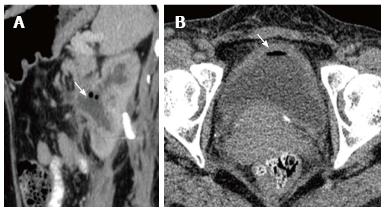
Figure 15 Emphysematous pyelitis and cystitis.
A: Para-sagittal reformatted CECT of a 42 years old diabetic lady showing air within dilated PCS with surrounding inflammatory changes; B: Axial CECT shows bladder wall thickening and air within the bladder lumen. PCS: Pelvicalyceal system; CECT: Contrast-enhanced computed tomography.
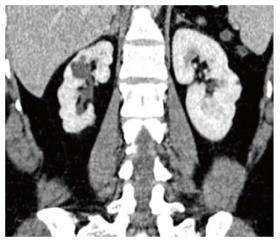
Figure 16 Coronal contrast-enhanced computed tomography shows atrophic right kidney with multiple cortical scars overlying the dilated calyces.
This appearance is typical of chronic pyelonephritis.
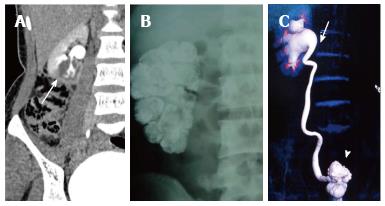
Figure 17 Renal tuberculosis.
A: Delayed CECT shows a cavitation at the lower pole of right kidney communicating with the PCS. This finding is fairly typical of GU TB. This adolescent male was a known case of pulmonary tuberculosis; B: Plain abdominal radiograph in a different patient shows diffuse parenchymal calcification of right kidney suggestive endstage autonephrectomy or putty kidney; C: Volume rendered technique image of delayed phase CECT shows a contracted thimble bladder (arrowhead), hiked up right pelvis (arrow) and hydroureteronephrosis. This patient had acid fast bacilli cultured from urine. PCS: Pelvicalyceal system; CECT: Contrast-enhanced computed tomography; TB: Tuberculosis.
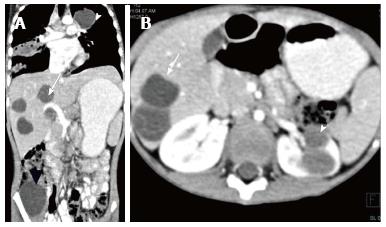
Figure 18 Disseminated hydatidosis.
A: Coronal reformatted CECT of a 7 years old boy shows multiple hydatid cysts in lung (white arrowhead), liver (arrow) and right iliacus (black arrowhead); B: Axial CECT shows multiple liver (arrow) and renal hydatid cysts (arrowhead). CECT: Contrast-enhanced computed tomography.
Figure 19 Fungal infection.
A: CECT shows liver, spleen and bilateral kidneys studded with small hypodense lesions in a 10 years old leukemia patient who was proven to have Aspergillus infection on aspiration cytology. The patient also had lung involvement with contiguous cardiac thrombus (not shown); B, C: Nephrographic (B) and delayed (C) phase CECT in a 26 years old aplastic anemia patient reveal a poorly enhancing, non-excreting left kidney with perinephric inflammation. Aorta and left renal artery are almost completely occluded by a non-enhancing thrombus (arrow B). On delayed image (Figure C), patchy areas of enhancement (arrow) noted in left kidney are characteristic of acute pyelonephritis. FNAC from the perirenal soft tissue revealed fungal hyphae and diagnosis of angioinvasive fungal infection (mucor) was made and Amphotericin B was started. However patient expired two days later. CECT: Contrast-enhanced computed tomography.
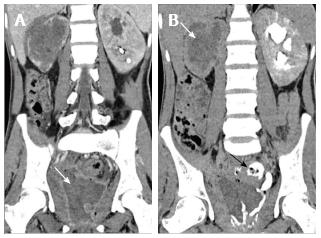
Figure 20 Eosinophilic cystitis.
A 25 years old man who presented with hematuria and worsening irritative symptoms over past one year. Clinical suspicion was that of a bladder malignancy. A: Coronal reformatted CECT in nephrographic phase shows diffuse mass like bladder wall thickening and irregularity with air specks in the wall. Mass like soft tissue is replacing entire right kidney with perinephric spread; B: Delayed coronal CECT shows opacification of rectum through a fistulous communication (arrow). Note made of striated nephrogram in left kidney suggesting ongoing acute inflammatory process. Biopsy revealed eosinophilic infiltration and fibrosis within the bladder wall with no evidence of malignancy. CECT: Contrast-enhanced computed tomography.
- Citation: Das CJ, Ahmad Z, Sharma S, Gupta AK. Multimodality imaging of renal inflammatory lesions. World J Radiol 2014; 6(11): 865-873
- URL: https://www.wjgnet.com/1949-8470/full/v6/i11/865.htm
- DOI: https://dx.doi.org/10.4329/wjr.v6.i11.865


