Copyright
©2014 Baishideng Publishing Group Inc.
World J Radiol. Nov 28, 2014; 6(11): 865-873
Published online Nov 28, 2014. doi: 10.4329/wjr.v6.i11.865
Published online Nov 28, 2014. doi: 10.4329/wjr.v6.i11.865
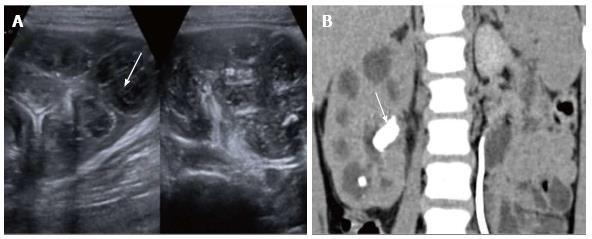
Figure 11 Xanthogranulomatous pyelonephritis.
A: USG shows enlarged kidney with parenchyma replaced with multiple hypoechoic masses (arrow, A) comprising inflammatory exudate; B: Computed tomography shows multiple low-attenuation rounded masses, corresponding to either dilated calyces or focal areas of parenchymal destruction with a central staghorn calculus (arrow, B).
- Citation: Das CJ, Ahmad Z, Sharma S, Gupta AK. Multimodality imaging of renal inflammatory lesions. World J Radiol 2014; 6(11): 865-873
- URL: https://www.wjgnet.com/1949-8470/full/v6/i11/865.htm
- DOI: https://dx.doi.org/10.4329/wjr.v6.i11.865


