Copyright
©2013 Baishideng Publishing Group Co.
World J Radiol. Sep 28, 2013; 5(9): 334-344
Published online Sep 28, 2013. doi: 10.4329/wjr.v5.i9.334
Published online Sep 28, 2013. doi: 10.4329/wjr.v5.i9.334
Figure 1 Using the regions of interest-enhancement tool of the OsiriX DICOM viewer for each of the measured b-values.
A: Representative regions of interest positioned in the spleen; B: With the resultant signal intensities seen for each of the three b-values (50, 400, 800).
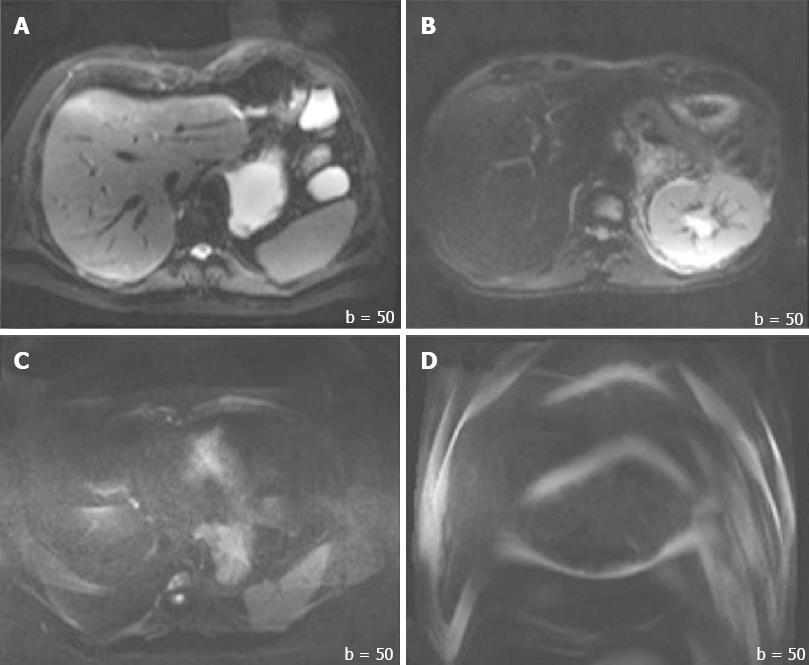
Figure 2 Sample images of quality graded by two radiologists.
A: 3 = good for interpretation without noticeable limitations [Image obtained on 2nd gen. 3.0T]; B: 2 = adequate for basic interpretation with minor limitations [Image obtained on 1.5T]; C: 1 = poor for basic interpretation [Image obtained on 1st gen. 3.0T]; and D: 0 = non-diagnostic and not adequate for basic interpretation [Image obtained on 1st gen. 3.0T]. All images were acquired at the same b-value (b = 50).
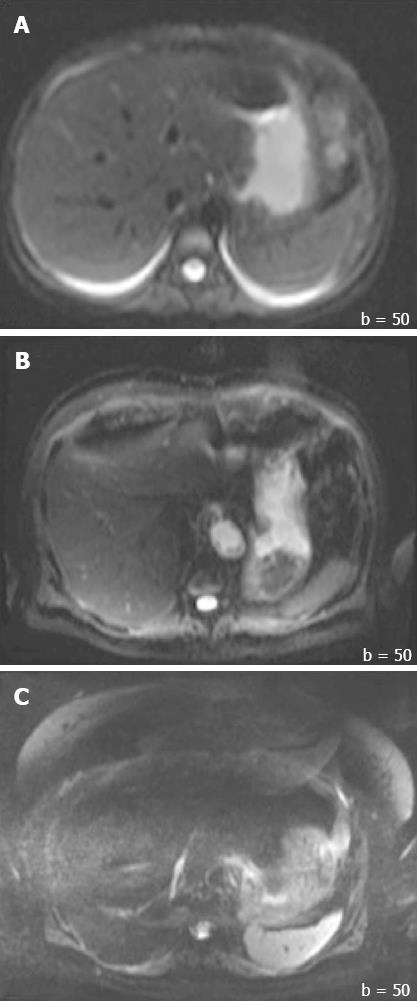
Figure 3 Sample images of ghosting artifact graded by two radiologists.
A: 3 = no ghosting; B: Ghosting not interfering with diagnostic image interpretation; and C: 1 = severe ghosting artifact interfering with diagnostic interpretation.
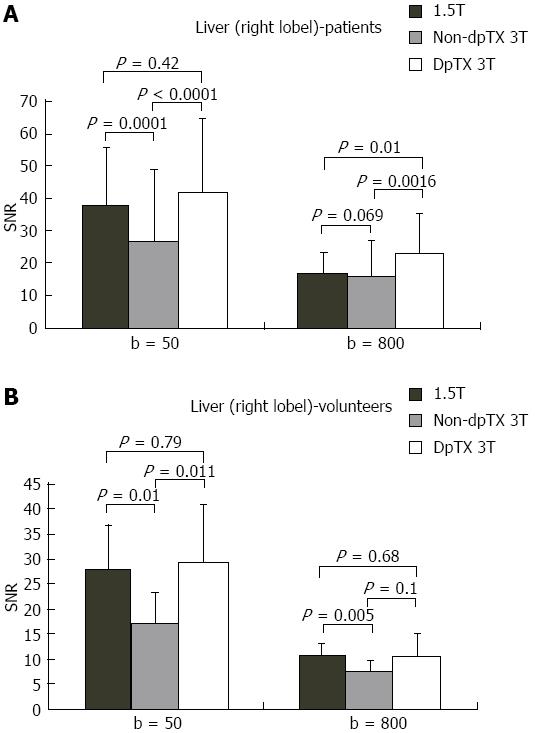
Figure 4 Bar charts of the distribution of signal-to-noise ratio values in the right lobe of the liver at b = 50/800 in the (A) patient and (B) volunteer population.
SNR: Single-to noise ratio.
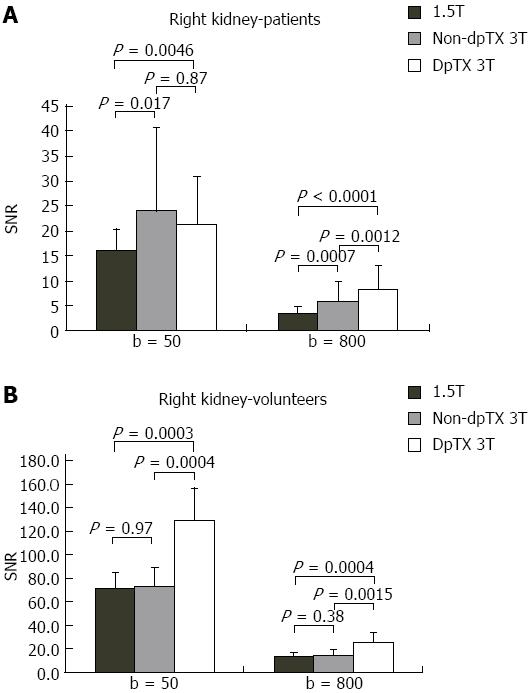
Figure 5 Bar charts of the distribution of signal-to-noise ratio values in the right kidney at b = 50/800 in the (A) patient and (B) volunteer population.
SNR: Single-to noise ratio.
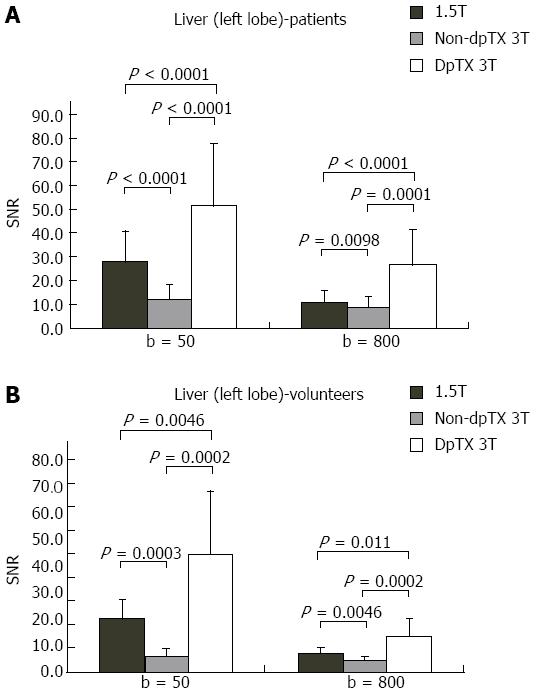
Figure 6 Bar charts of the distribution of signal-to-noise ratio values in the left lobe of the liver at b = 50/800 in the (A) patient and (B) volunteer population.
SNR: Single-to noise ratio.
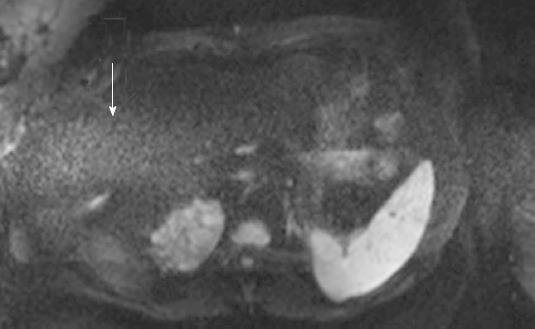
Figure 7 A band of high intensity artifact (arrow) across the middle of the abdomen in diffusion-weighted images obtained on non-dpTX 3.
0T (i.e., noise band reconstruction artifact), which contributed to high signal intensity measurements in the caudate lobe and head of the pancreas, as seen on several studies.
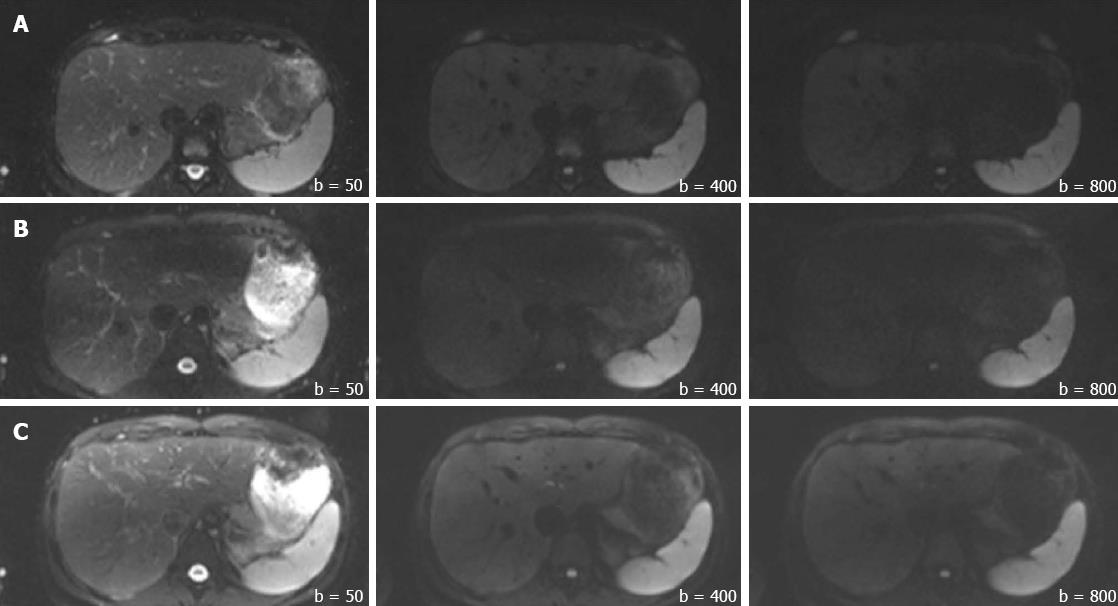
Figure 8 Representative images from the volunteers in the 1.
5T (Row A), non-dpTX 3.0T (Row B), and dpTX 3.0T (Row C) scanners. From left to right within each row, b-values increase from 50, 400, to 800 s/mm².
- Citation: Riffel P, Rao RK, Haneder S, Meyer M, Schoenberg SO, Michaely HJ. Impact of field strength and RF excitation on abdominal diffusion-weighted magnetic resonance imaging. World J Radiol 2013; 5(9): 334-344
- URL: https://www.wjgnet.com/1949-8470/full/v5/i9/334.htm
- DOI: https://dx.doi.org/10.4329/wjr.v5.i9.334


