Copyright
©2013 Baishideng Publishing Group Co.
World J Radiol. Sep 28, 2013; 5(9): 334-344
Published online Sep 28, 2013. doi: 10.4329/wjr.v5.i9.334
Published online Sep 28, 2013. doi: 10.4329/wjr.v5.i9.334
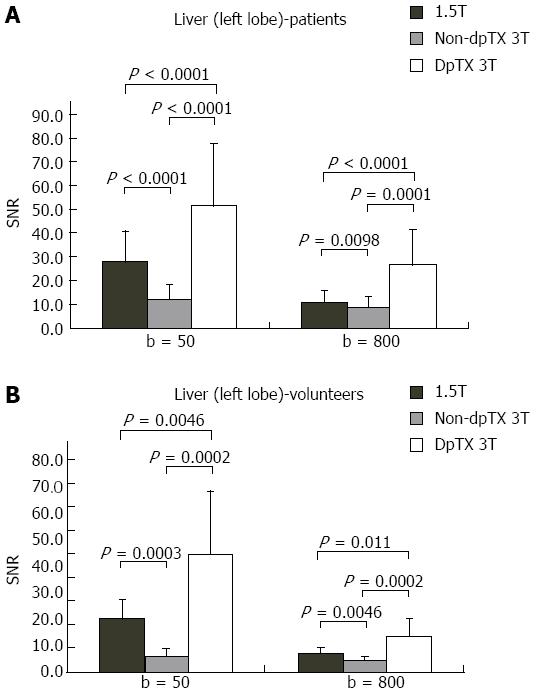
Figure 6 Bar charts of the distribution of signal-to-noise ratio values in the left lobe of the liver at b = 50/800 in the (A) patient and (B) volunteer population.
SNR: Single-to noise ratio.
- Citation: Riffel P, Rao RK, Haneder S, Meyer M, Schoenberg SO, Michaely HJ. Impact of field strength and RF excitation on abdominal diffusion-weighted magnetic resonance imaging. World J Radiol 2013; 5(9): 334-344
- URL: https://www.wjgnet.com/1949-8470/full/v5/i9/334.htm
- DOI: https://dx.doi.org/10.4329/wjr.v5.i9.334


