Copyright
©2013 Baishideng.
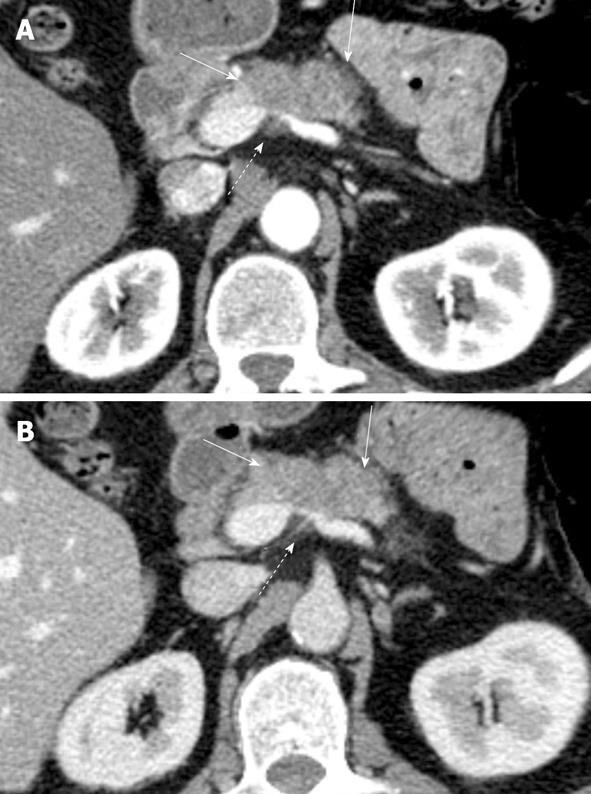
Figure 1 Axial images from dual phase pancreas protocol contrast enhanced computed tomography examination in patient with history of pancreatic cancer shows (A) better demarcation of tumor (solid arrows) on the pancreatic parenchymal phase than on the (B) portal venous phase.
There is marked narrowing of the splenoportal confluence (dashed arrows) secondary to encasement.
Figure 2 Patient with locally advanced pancreatic cancer.
A-C: Pancreatic parenchymal phase images show tumor (arrowheads) (A) encasing the common hepatic artery (CHA) and splenic artery (SA) (B) encasing the celiac axis (CA) and (C) abutting the superior mesenteric artery (SMA); D: Coronal reformation helps demonstrate the encasement of the celiac artery and abutment of the superior mesenteric artery. R: Right; L: Left.
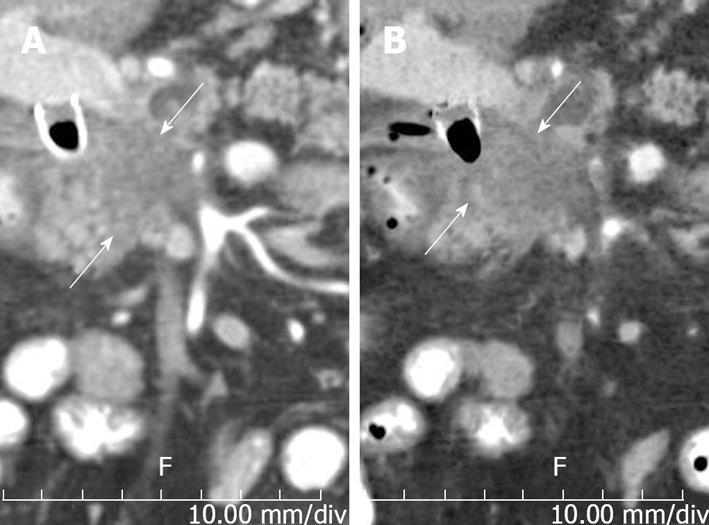
Figure 3 Utility of reconstructions.
A: Coronal reconstruction demonstrating craniocaudal extent of tumor (arrows); B: Coronal Minip (minimum intensity projection), same obliquity and orientation as a emphasizes low density structures, making tumor more conspicuous.
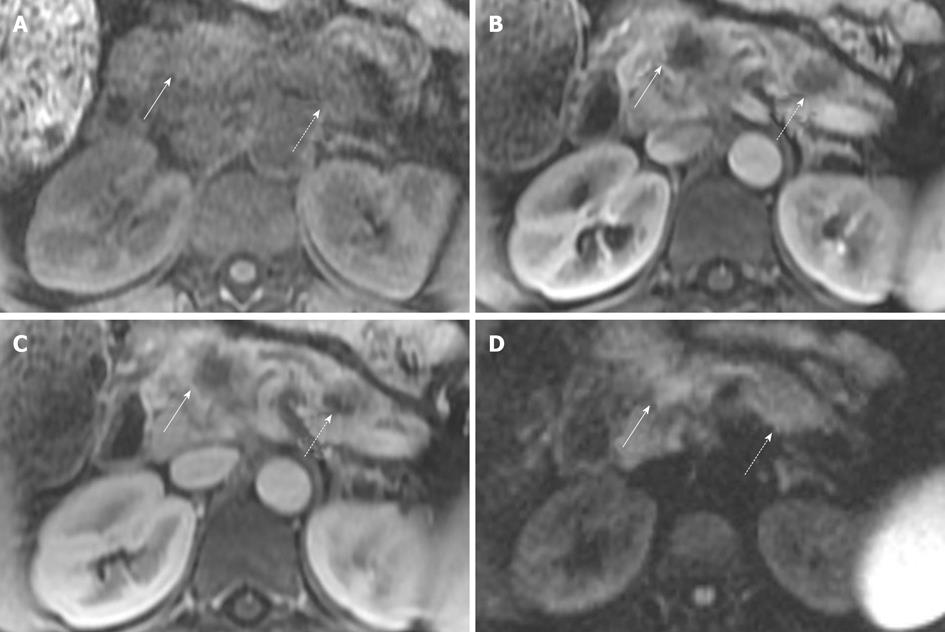
Figure 4 Magnetic resonance imaging of patient with two sites of pancreatic cancer.
A: T1 fat suppressed images do not show the tumor well in this patient, but are often helpful. Solid arrow indicates the pancreatic neck tumor, dashed arrow indicates the pancreatic tail tumor; B, C: However, both sites are well seen, in the neck (solid arrows) and tail (dashed arrows) on the pancreatic parenchymal phase (B) and the portal venous phase (C); D: In this case sites of tumor are not well seen on diffusion weighted imaging. Solid arrow indicates the pancreatic neck tumor, dashed arrow indicates the pancreatic tail tumor. Conspicuity of the primary lesion can be very variable on diffusion weighted imaging.
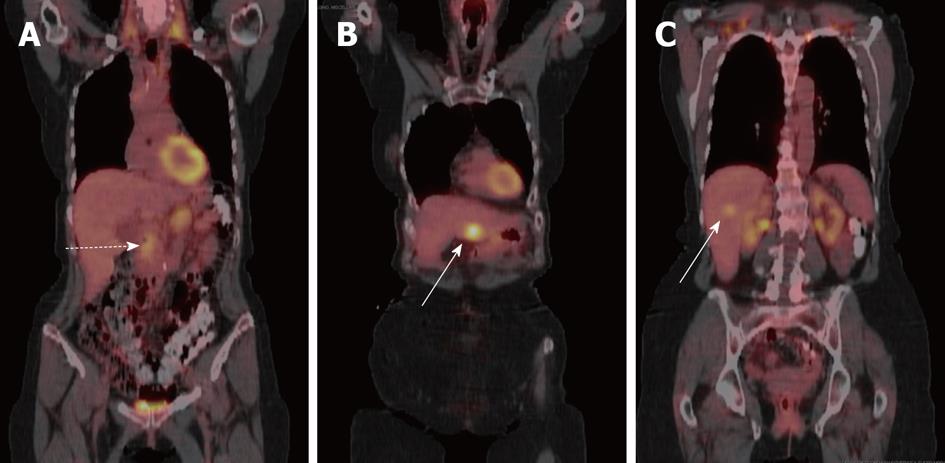
Figure 5 Coronal fused positron emission tomography with computed tomography images of patient with pancreatic cancer and liver metastases.
A: Primary tumor shows mild-moderate uptake (dashed arrow); B, C: While liver metastases in (B) and (C) show variable uptake (solid arrows).
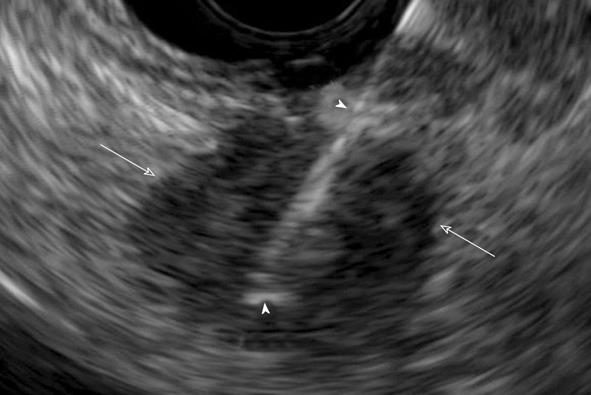
Figure 6 Endoscopic ultrasound guided biopsy of pancreatic cancer manifesting as a hypoechoic mass (arrows).
Biopsy needle is visualized during the procedure (arrowheads).
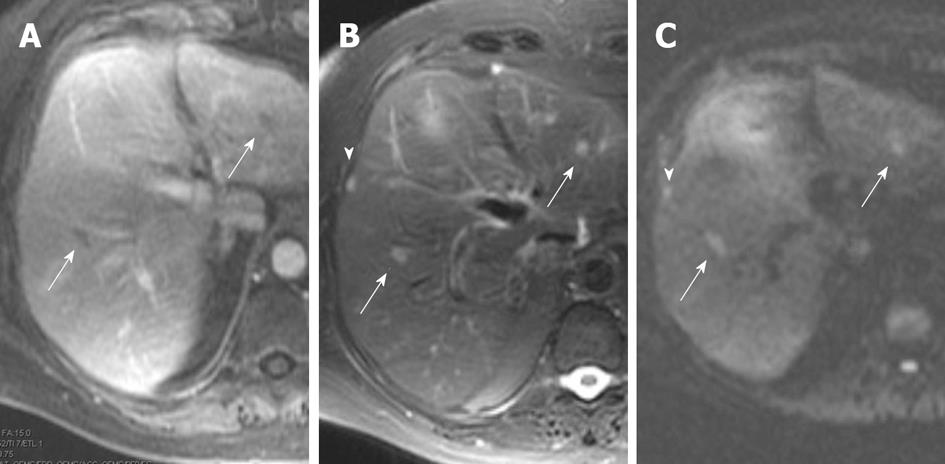
Figure 7 Magnetic resonance imaging images from patient with liver metastases from biopsy proven pancreatic cancer.
A: Portal venous phase image, shows two hypointense foci (arrows) within the liver; B: T2 fat suppressed images also show the two lesions and show to better effect the subcapsular metastasis (arrowhead), arrows are metastases in liver parenchyma; C: Diffusion weighted image (b value of 500 s/mm2) shows all three lesions well, without confounding T2 bright signal in biliary tree or vessels seen on T2 weighted images. Arrows are metastases in liver parenchyma, arrowhead is the subcapsular liver metastasis.
- Citation: Tamm EP, Bhosale PR, Vikram R, de Almeida Marcal LP, Balachandran A. Imaging of pancreatic ductal adenocarcinoma: State of the art. World J Radiol 2013; 5(3): 98-105
- URL: https://www.wjgnet.com/1949-8470/full/v5/i3/98.htm
- DOI: https://dx.doi.org/10.4329/wjr.v5.i3.98


