Copyright
©2013 Baishideng.
Figure 1 Leiomyosarcoma metastasis to liver.
A: Axial fat-suppressed, T2-weighted (T2W) Fast Spin-Echo image; B: Post contrast T1-weighted gradient recalled-echo image; C: Diffusion-weighted imaging; D: Apparent diffusion coefficient (ADC) map. The T2W hyperintense and rim-enhancing lesion is a pathologically established metastasis (arrow) with an ADC value of 0.9 × 10⁻³ mm2/s, indicating impeded diffusion likely due to its highly cellular nature.
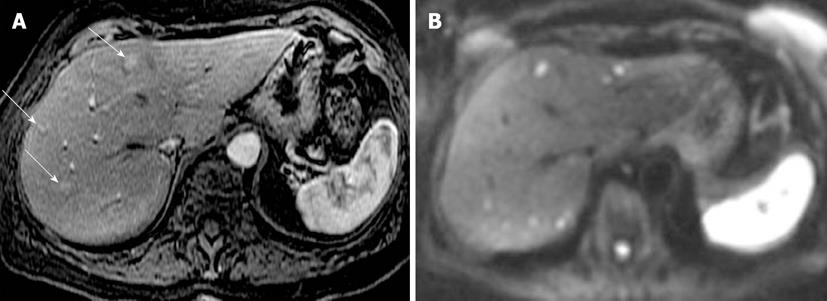
Figure 2 Neuroendocrine metastases to liver.
A: Axial arterial phase post contrast T1-weighted (T1W) gradient recalled-echo; B: Diffusion-weighted image (DWI). Only 3 enhancing metastatic lesions are seen on the post contrast T1W image. DWI increases conspicuity of these lesions and also shows many more bilobar high signal metastatic lesions with impeded diffusion.
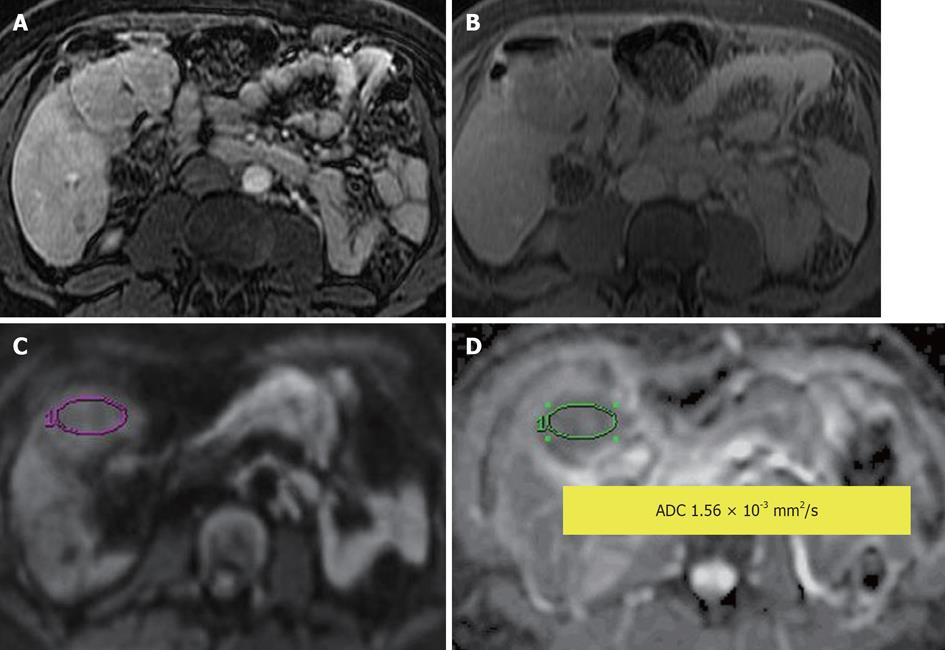
Figure 3 Hepatocellular adenoma.
A: Contrast-enhanced T1-weighted gradient recalled-echo in arterial phase; B: Delayed post contrast phase; C: Diffusion-weighted image; D: Apparent diffusion coefficient (ADC) map. An arterial enhancing lesion with delayed wash out is visible; it demonstrates impeded diffusion with ADC = 1.56 × 10⁻³ mm2/s.
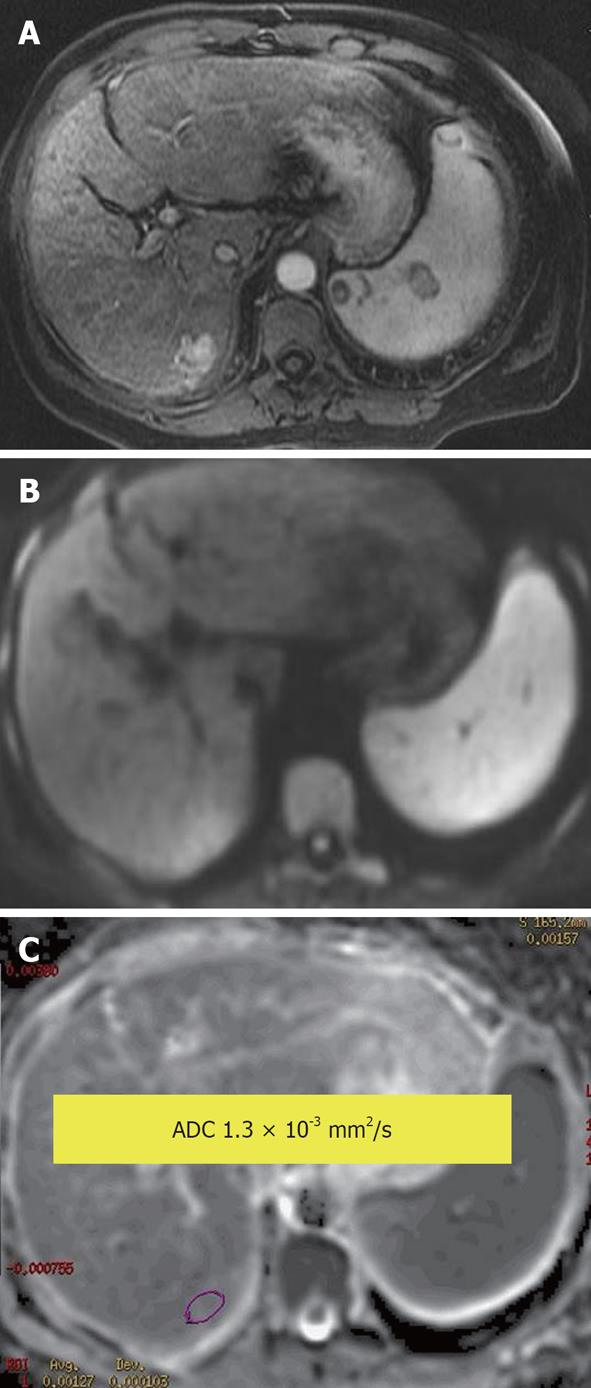
Figure 4 Hepatocellular carcinoma.
A: Enhanced arterial phase T1-weighted gradient recalled-echo; B: Diffusion-weighted image; C: Apparent diffusion coefficient (ADC) map. An arterial enhancing lesion with impeded diffusion and ADC = 1.3 × 10⁻³ mm2/s is visible.
Figure 5 Focal nodular hyperplasia.
A: Enhanced arterial phase; B: Venous phase T1-weighted gradient recalled-echo; C: Diffusion-weighted image; D: Apparent diffusion coefficient map (ADC). An arterial enhancing lesion which becomes isointense to slightly hyperintense to liver on venous phase and shows impeded diffusion with ADC of 1.3 × 10⁻³ mm2/s.
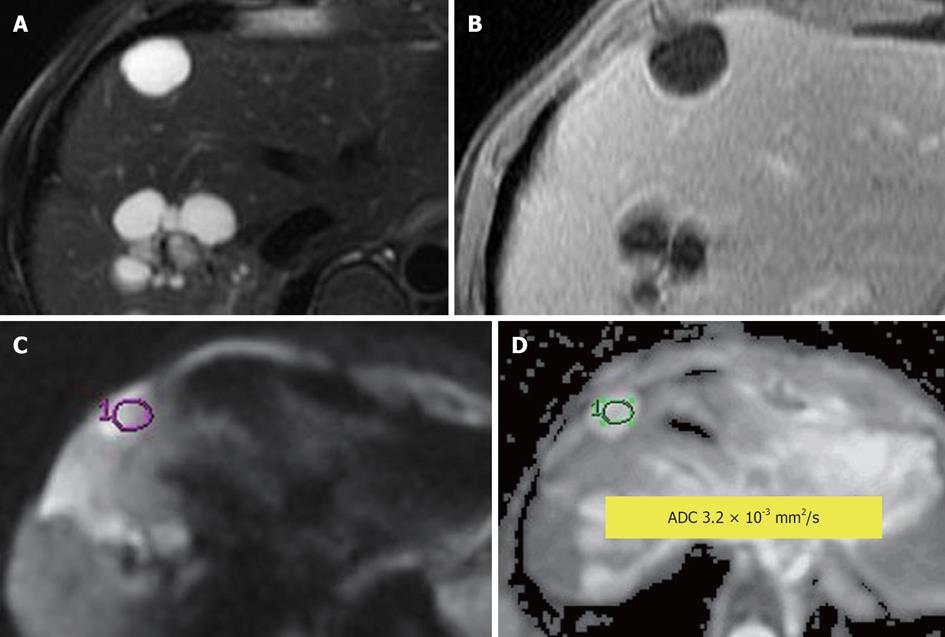
Figure 6 Simple hepatic cyst.
A: Fat-suppressed T2-weighted (T2W) Fast Spin-Echo; B: Enhanced T1-weighted gradient recalled-echo; C: Diffusion-weighted image; D: Apparent diffusion coefficient (ADC) map. A T2W hyperintense non-enhancing lesion consistent with a simple cyst with ADC = 3.2 × 10⁻³ mm2/s. No impeded diffusion is visible.
Figure 7 Cavernous hemangioma in the liver.
A: Fat-suppressed T2-weighted (T2W) Fast Spin-Echo; B: Enhanced (arterial phase) T1-weighted gradient recalled-echo; C: Diffusion-weighted image; D: Apparent diffusion coefficient map (ADC) map. A cavernous hemangioma with a typical T2W hyperintense signal and enhancement (peripheral discontinuous on arterial post contrast phase) characteristics and ADC = 1.6 × 10⁻³ mm2/s.
Figure 8 Liver abscess in a patient with Crohn disease.
A: Axial post contrast T1-weighted gradient recalled-echo; B: Diffusion-weighted image image. Rim enhancing lesion is seen in the right hepatic lobe, with corresponding bright lesion on diffusion weighted image. The apparent diffusion coefficient map (not shown) showed corresponding hypointense lesion suggesting true impeded diffusion. This should not be confused with liver tumors which may also show impeded diffusion. Appropriate clinical settings should suggest the diagnosis. The lesion resolved with antibiotics on follow-up.
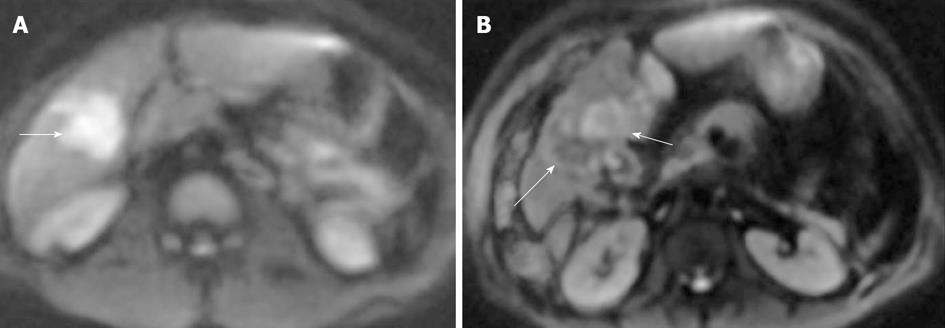
Figure 9 Hepatocellular carcinoma (arrows) on diffusion-weighted image (A) before and (B) after transarterial chemoembolization.
A: Hepatocellular carcinoma (HCC) was hyperintense compared with the cirrhotic liver on diffusion weighted image, with an apparent diffusion coefficient (ADC) = 1.41 × 10⁻³ mm2/s vs 1.08 × 10⁻³ mm2/s for the liver; B: After transarterial chemoembolization, HCC showed a residual area of hyperintense signal (short arrow) with ADC = 1.38 × 10⁻³ mm2/s (residual tumor) and a new area of hypointense signal (long arrow) with ADC = 1.87 × 10⁻³ mm2/s (coagulation necrosis), indicating a partial response. This finding of necrosis was supported by lack of enhancement on gadolinium-enhanced imaging and confirmed on follow-up studies.
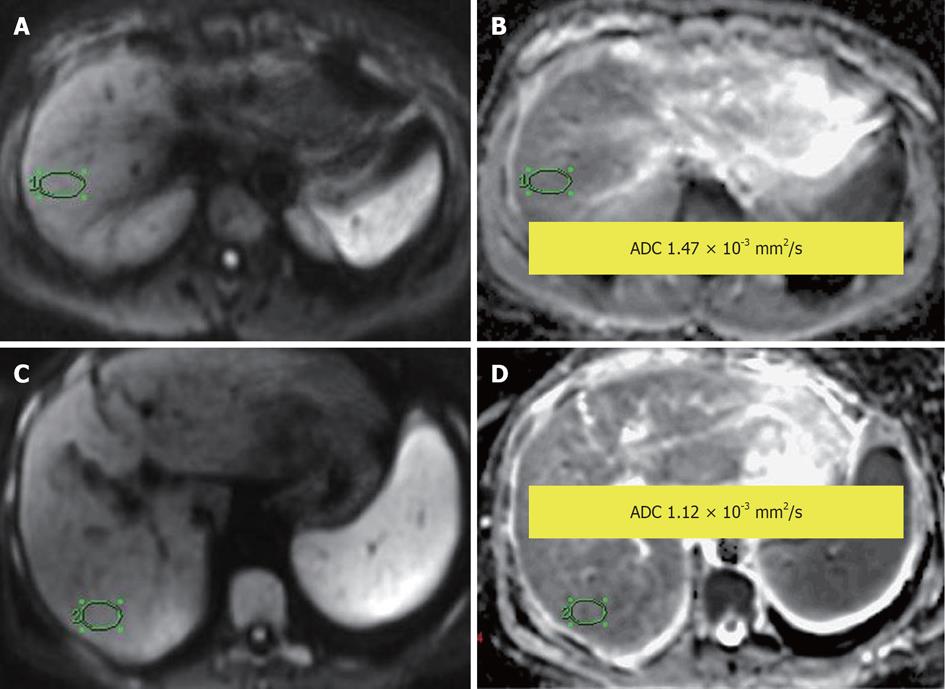
Figure 10 Normal liver parenchyma.
A, B: Diffusion-weighted image (DWI) (A) and apparent diffusion coefficient (ADC) map (B), showing ADC = 1.47 × 10⁻³ mm2/s; Liver cirrhosis: (C) DWI and (D) ADC map, showing ADC = 1.12 × 10⁻³ mm2/s.
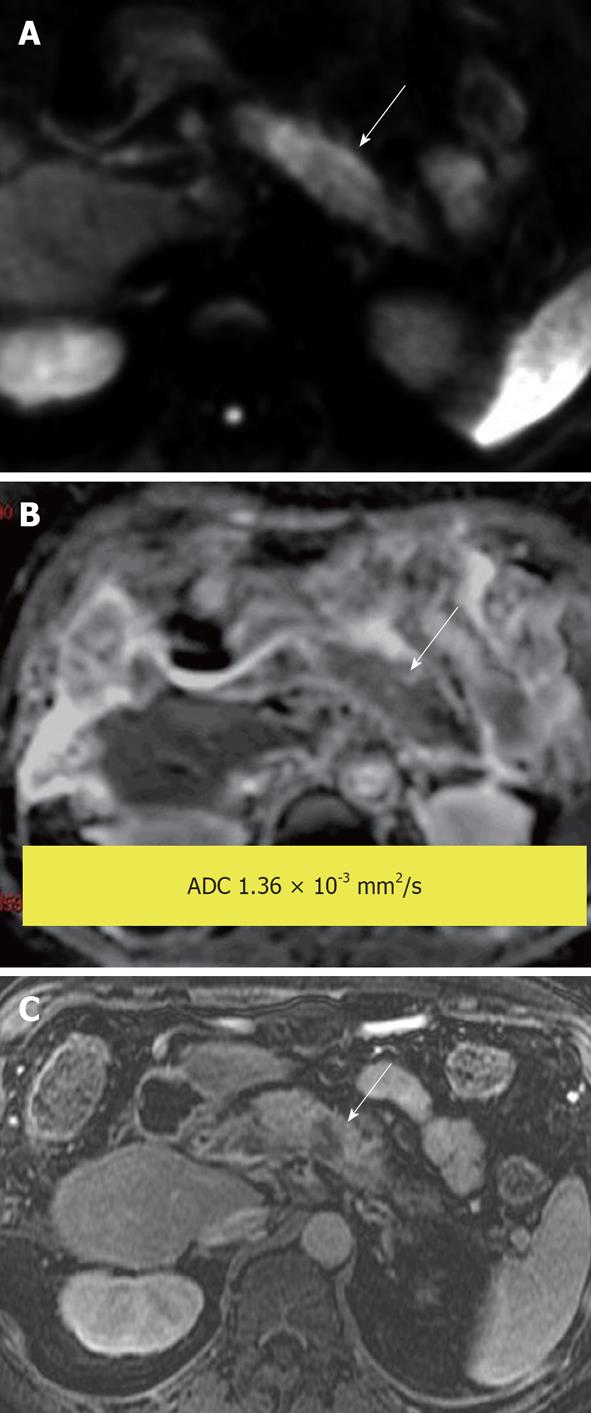
Figure 11 Pancreatic ductal adenocarcinoma.
Hyperintense mass demonstrated on (A) diffusion-weighted image due to impeded diffusion, confirmed by a hypointense signal on (B) apparent diffusion coefficient map. Findings are supported by a (C) post-gadolinium T1-weighted image that shows the tumor to be hypo enhancing compared with the enhancing pancreatic parenchyma.
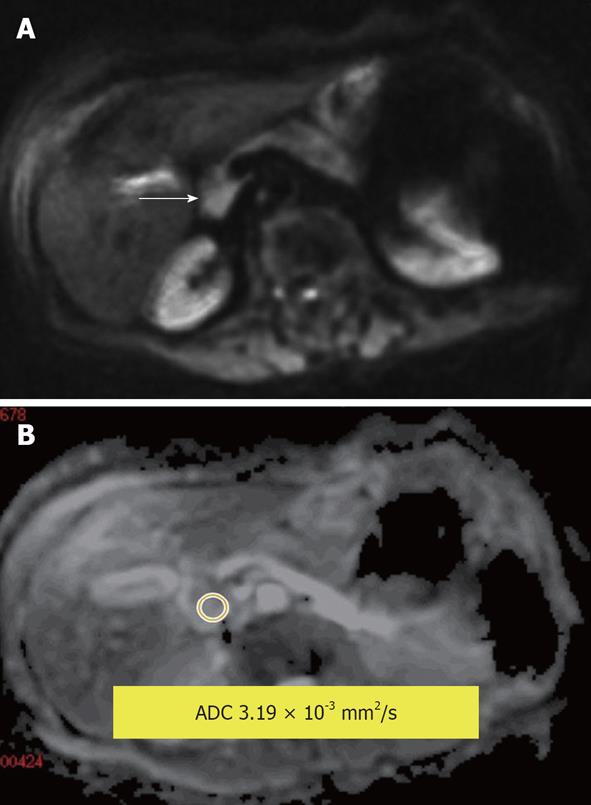
Figure 12 Serous cystadenoma in the pancreatic head.
A: Diffusion-weighted image; B: Apparent diffusion coefficient (ADC) map. Measured lesion ADC = 3.19 × 10⁻³ mm2/s. The internal reference can be used; the reference for the fluid in this study (cerebrospinal fluid) was ADC = 3.78 × 10⁻³ mm2/s.
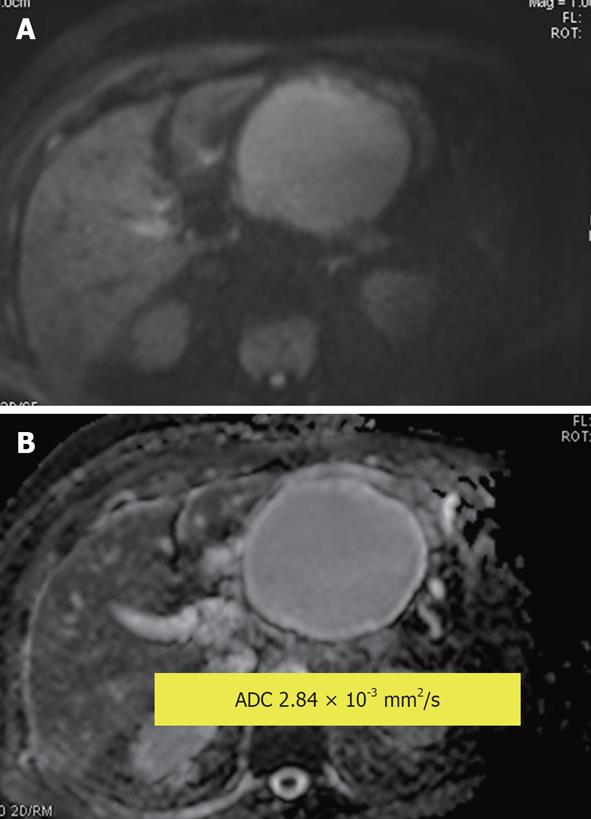
Figure 13 Pancreatic pseudocyst.
A: Diffusion-weighted image (DWI); B: Apparent diffusion coefficient (ADC) map. Hyperintensity of the cyst on DWI is due to the T2 shine through effect. Measured lesion ADC = 2.84 × 10⁻³ mm2/s. The reference for the fluid in this study (cerebrospinal fluid) was ADC = 4.06 × 10⁻³ mm2/s.
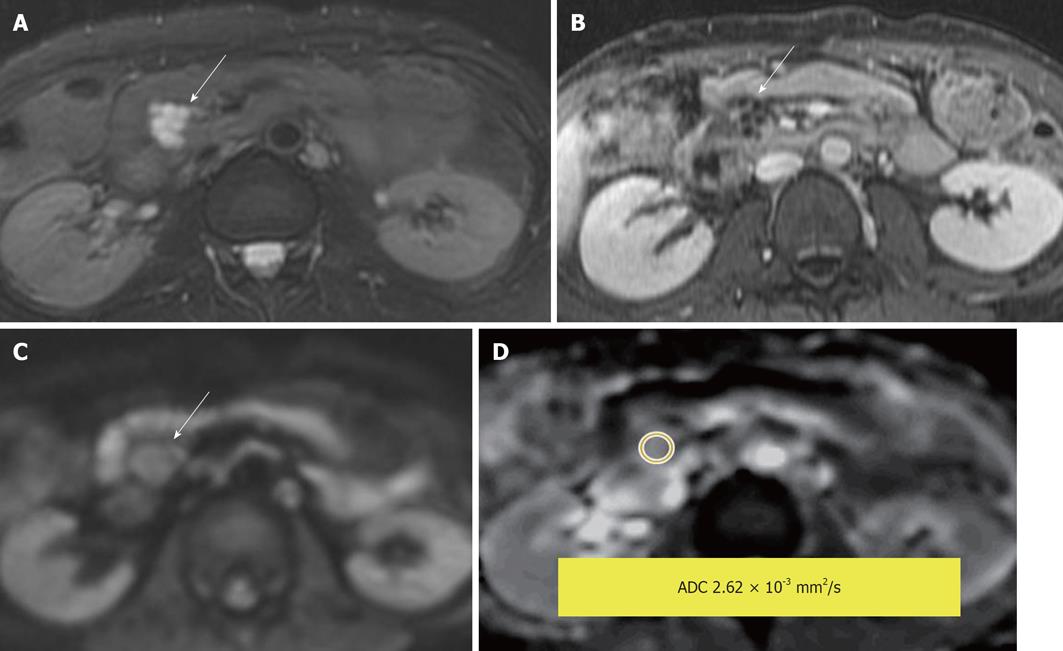
Figure 14 Side branch intraductal papillary mucinous neoplasms.
A: Fat-saturated T2-weighted (T2W) Fast Spin-Echo; B: Post contrast T1-weighted gradient recalled-echo; C: Diffusion-weighted image; D: Apparent diffusion coefficient (ADC) map. A lobulated T2W hyperintense lesion with enhancement of the rim and internal septae. The measured lesion ADC = 2.62 × 10⁻³ mm2/s. The reference for fluid in this study (cerebrospinal fluid) was ADC = 3.36 × 10⁻³ mm2/s.
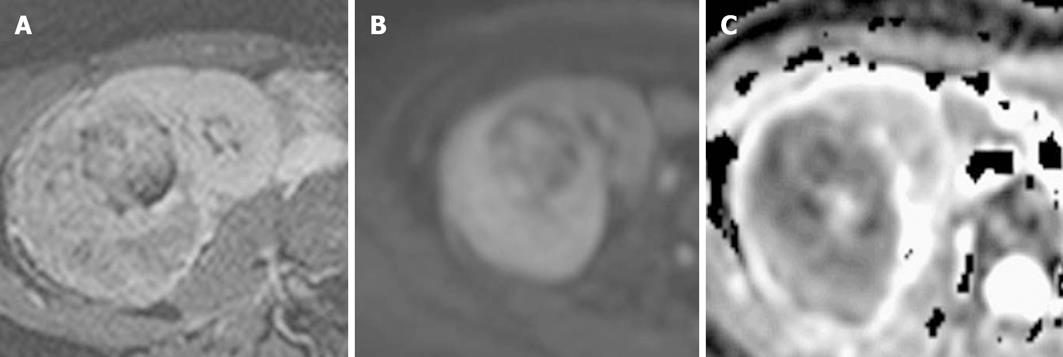
Figure 15 Renal cell carcinoma.
(A) Heterogeneously enhancing mass on post contrast T1-weighted gradient recalled-echo image, demonstrating a high signal on (B) diffusion-weighted image and a low signal on (C) apparent diffusion coefficient, indicating impeded diffusion.
Figure 16 Diffusion-weighted image and apparent diffusion coefficient map.
A: An adrenal mass with impeded diffusion and apparent diffusion coefficient (ADC) = 1.84 × 10⁻³ mm2/s; B: An adrenal mass with impeded diffusion and ADC = 1.47 × 10⁻³ mm2/s.
Figure 17 Peritoneal metastases on diffusion-weighted image.
A: Due to ascites, peritoneal nodules are not well seen on b = 0 sequence of diffusion-weighted image; B: But, on b = 500, all the ascites is suppressed and peritoneal nodules/metastases become conspicious (arrows).
- Citation: Morani AC, Elsayes KM, Liu PS, Weadock WJ, Szklaruk J, Dillman JR, Khan A, Chenevert TL, Hussain HK. Abdominal applications of diffusion-weighted magnetic resonance imaging: Where do we stand. World J Radiol 2013; 5(3): 68-80
- URL: https://www.wjgnet.com/1949-8470/full/v5/i3/68.htm
- DOI: https://dx.doi.org/10.4329/wjr.v5.i3.68


