Copyright
©2013 Baishideng Publishing Group Co.
World J Radiol. Nov 28, 2013; 5(11): 386-397
Published online Nov 28, 2013. doi: 10.4329/wjr.v5.i11.386
Published online Nov 28, 2013. doi: 10.4329/wjr.v5.i11.386
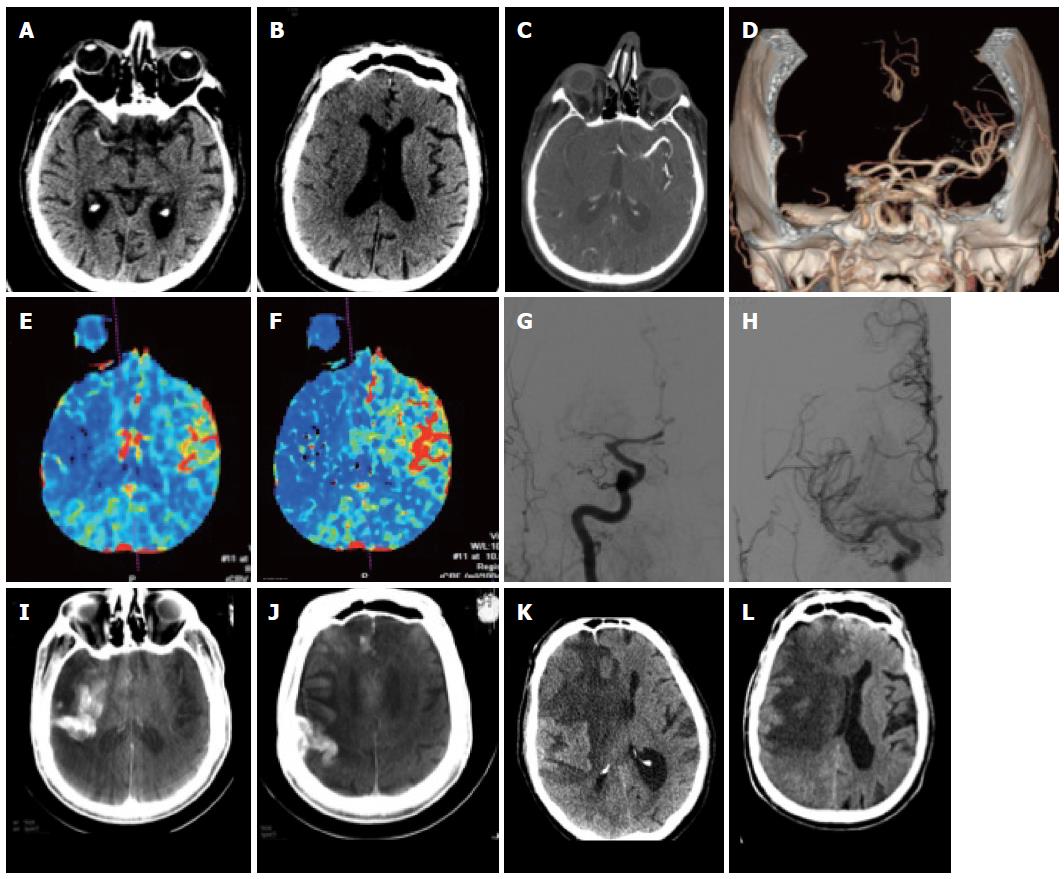
Figure 1 Patient with acute stroke.
A: Unenhanced computed tomography (CT) at 3.5 h after onset shows hyperdense MCA on the right; B, C: There are subtle signs of grey-white dedifferentiation: the insula and the basal ganglia on the right are not distinguishable; the sulci on the right side are also slightly less visible; C-F: CT angiography shows an M1 occlusion on the right (C, D) with hypoperfusion with drops in the rCBV (E) and rCBF (F) maps in the right MCA territory; G, H: This patient underwent DSA that confirmed the right MCA occlusion (G) which was recanalized (H); I, J: On follow-up CT images reconstructed from the expert CT data set acquired with the flat panel angio unit there is initially contrast extravasation; K, L: Further follow-up CT showed marked midline shift due to almost complete right MCA infarction.
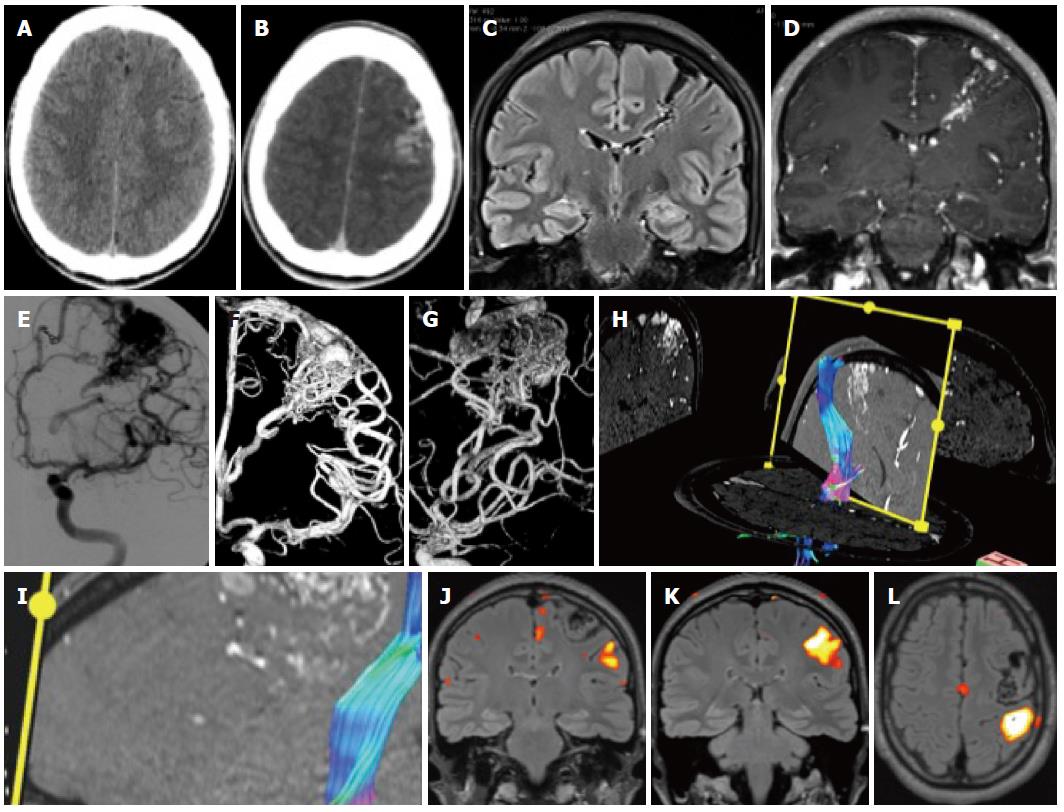
Figure 2 Patient with epilepsy.
A: Unenhanced computed tomography (CT) shows discrete hyperdensities in the left frontal white matter; B: After contrast administration, vascular structures are seen in the left frontal lobe, raising the suspicion of an AVM. On magnetic resonance imaging (MRI) one can see typical findings due to an Arteriovenous malformation; C, D: Long flow voids on the FLAIR images that run from the cortex to the paraventricular region in a triangular pattern; E-G: The Angiogram in same patient showing frontal AVM; H, I: Tractography shows the AVM to be close but separated from the corticospinal tract; J-L: Functional MRI was done with a motor paradigm that demonstrates cortical activation in the frontal motor cortex, the AVM is shown to be located anteriorly and superiorly to the activated area.
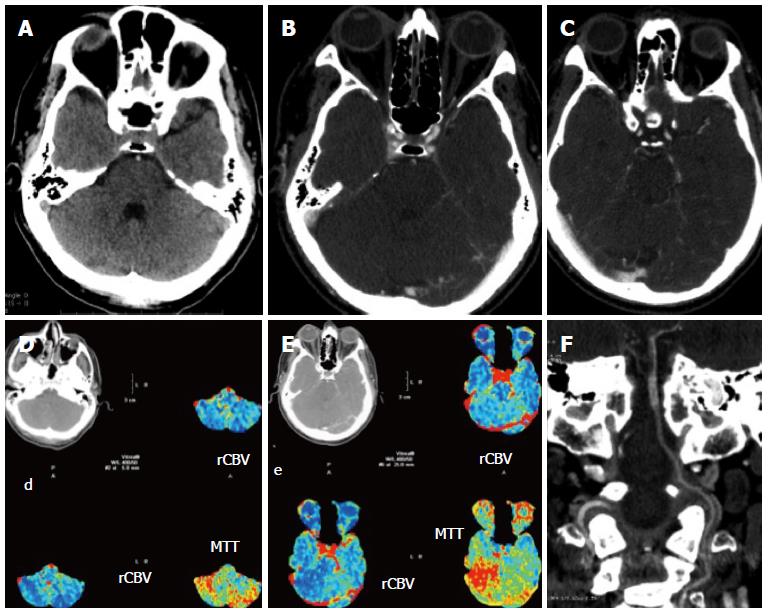
Figure 3 Patient with symptoms referable to the posterior fossa.
A-C: Unenhanced computed tomography (CT) shows a possible hyperdense artery sign of the basilar artery (A) which is confirmed by CT angiography: the basilar artery enhances less than the rest of the vessels (B, C); D, E: Perfusion imaging shows a drop in hemodynamics in the posterior fossa; F: The coronal reconstruction of the angio-CT shows well the length of the thrombus.
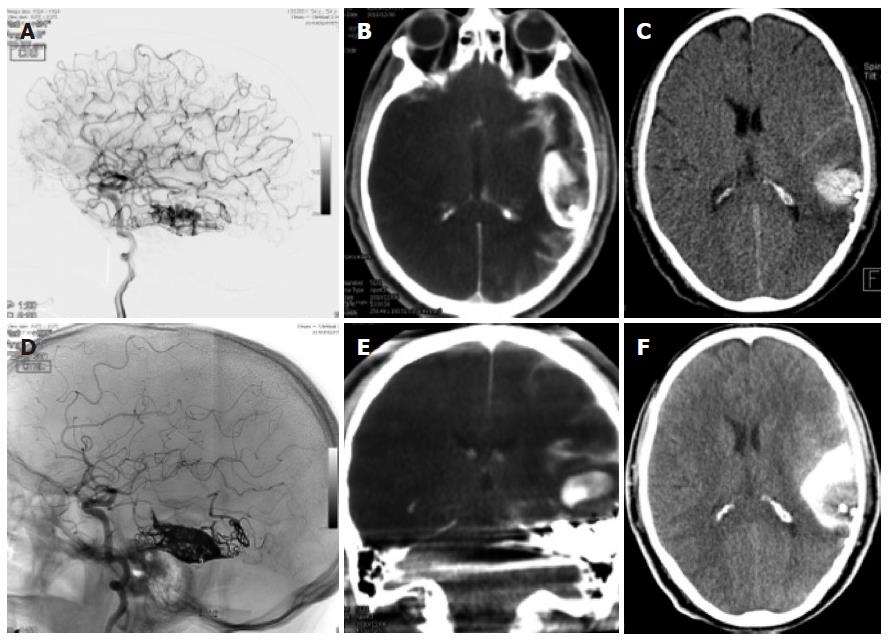
Figure 4 Dual energy computed tomography.
A, D: Patient having undergone angiography and embolization for a temporal left AVM; B, E: On the immediate expert computed tomography (CT) performed on the angio table, there was a large area of hyperdensity with probably contrast and blood but which were not distinguishable from one another: the Dual source CT shows that this is mainly due to contrast since there is sonly a small area of blood surrounding the embolized material; C, F: Again a normal C CT afterwards shows the more extensive hyperdensity in the subarachnoid regions due to contrast and blood.
Figure 5 Diffusion images performed after catheter angiography demonstrating multiple small asymptomatic lesions in both brain hemispheres (arrows).
They are found in the hippocampus (A), the left frontal lobe (B), the parietal lobes (C, D).
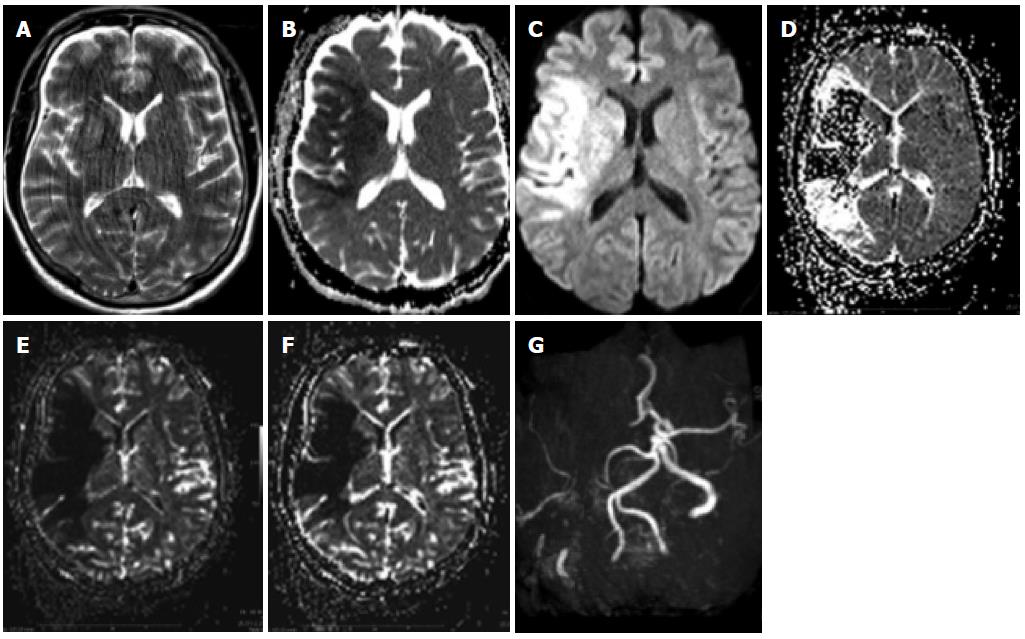
Figure 6 Patient with penumbra and mismatch.
A: A patient with an acute left-sided hemisyndrome was referred to our hospital: T2 images showed no clear signs of ischemia despite motion artifacts; B, C: The apparent diffusion coefficient (ADC) was lowered in the right MCA territory with a corresponding hyperintensity on the diffusion-weighted imaging (DWI) images with the maximum b value; D-F: There was additional hypoperfusion in a more extensive area on the MTT maps (D) as well as on the maps of rCBV (E) and RCB (F), which was sue to an occlusion of the MCA on the right.
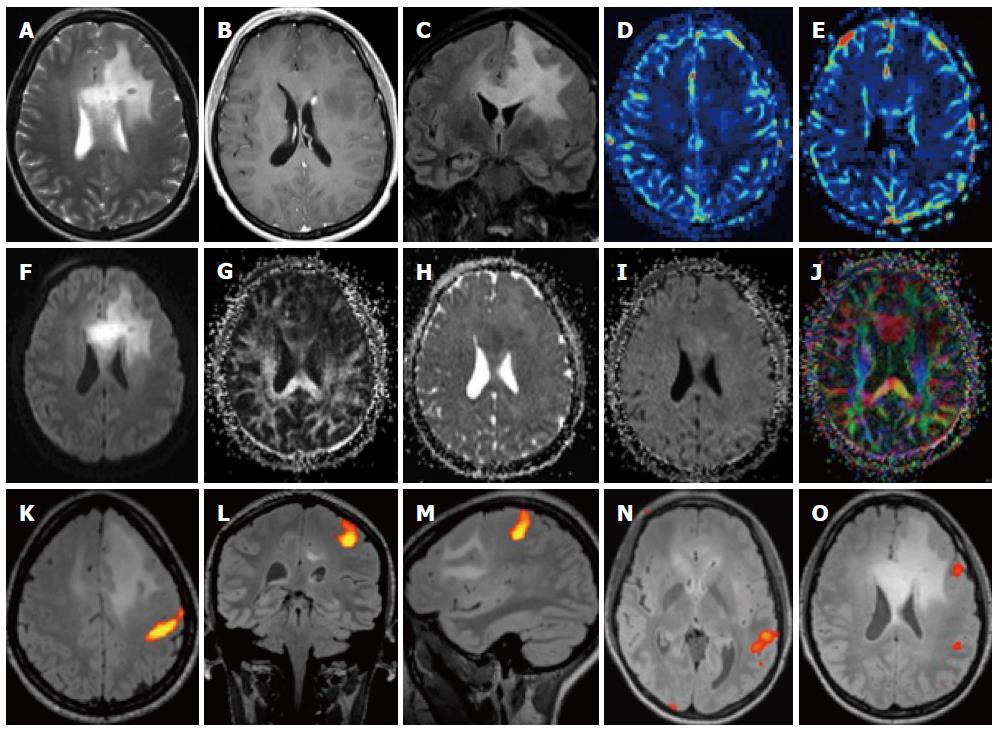
Figure 7 Patient with left frontal glioma.
A-C: On T2 images there is a large area of high density in the frontal lobe which infiltrates the corpus callosum (A), there is a small deep paraventricular enhancement (B) and the involvement of the callosal white matter is better seen on the coronal FLAIR image (C); D-G: The lesion is hypoperfused (D, E) and there is a high signal on diffusion-weighted imaging (DWI) (F), a low FA (G) as well as a slightly lower ADC; K-O: Functional magnetic resonance (MR) with motor paradigms (K-M) as well as language paradigms was performed (N, O). The lesion is located in the frontal lobe, well demarcated from the motor cortex (K) but close to Broca’s area (O).
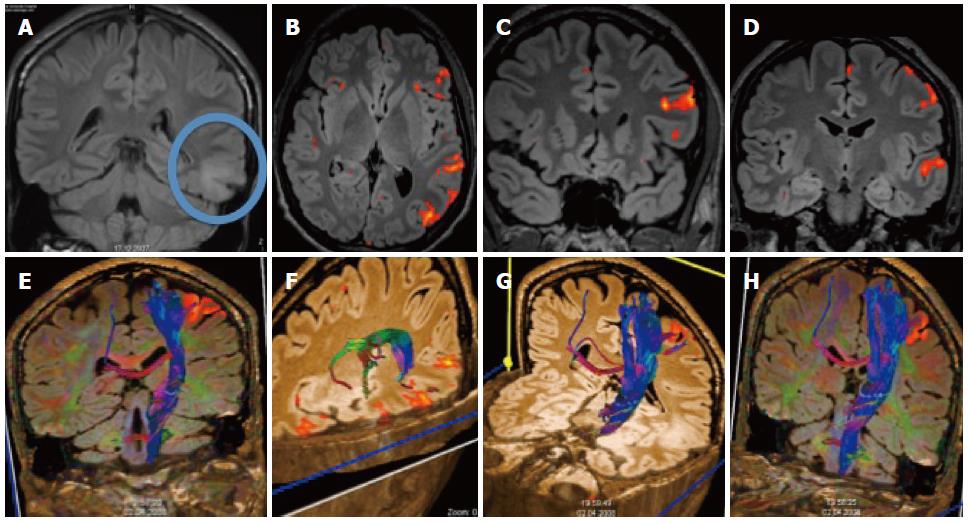
Figure 8 Patient with temporal glioma.
A: The cortical and subcortical lesionis best seen on the coronal FLAIR; B-D: Additional functional magnetic resonance imaging with language paradigms showed the tumor to be well demarcated from the Broca and Wernicke areas; E-H: Additional DTI shows the location of the long cortico-spinal tracts: the pyramidal tract is displayed in relation to the frontal cortical activation obtained with a motor paradigm.
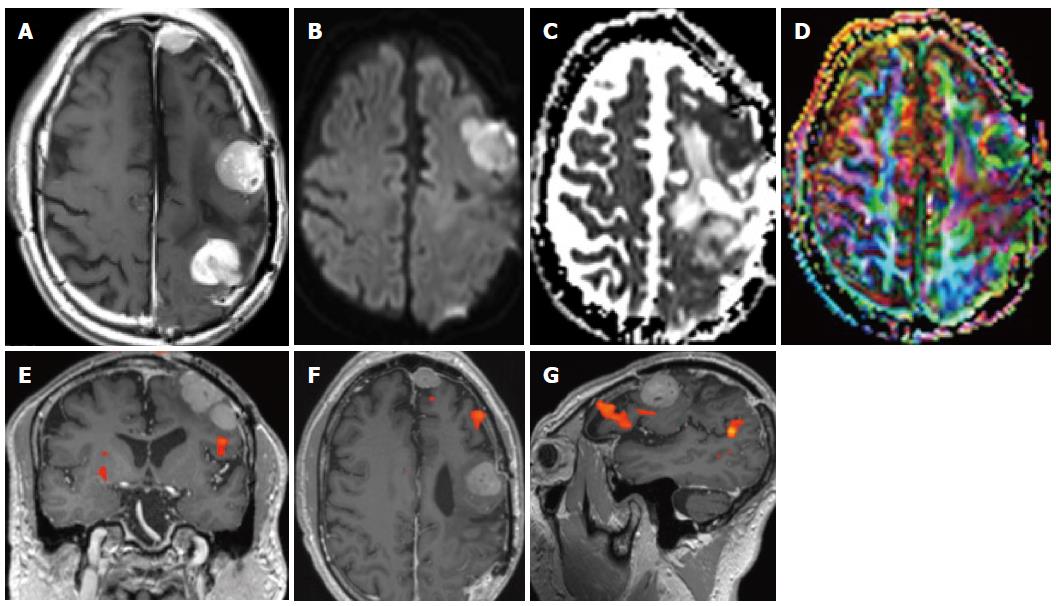
Figure 9 Patient with meningiomatosis.
On conventional T1-weighted magnetic resonance (MR) with contrast multiple cortical nodules are seen (A) on diffusion the lesions are slightly hyperintense, corresponding to high cellularity (B, C) along with a reduced anisotropy (D).
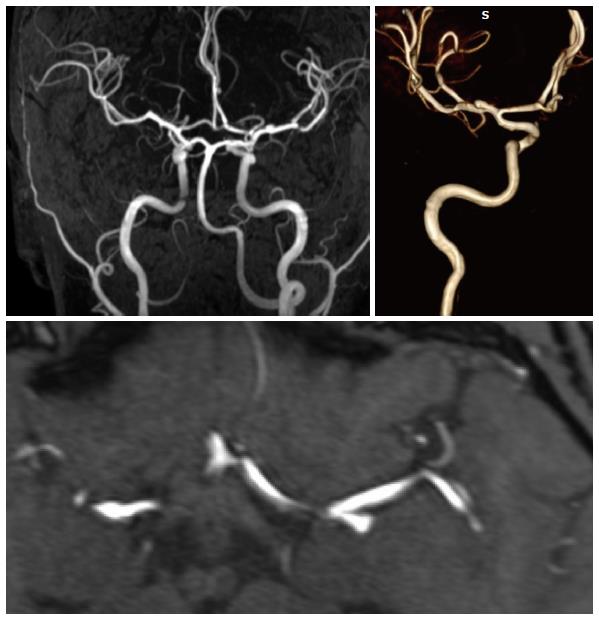
Figure 10 High resolution MRA of an MCA bifurcation aneurysm: A long vascular coverage is possible from the cervical region to the distal MCA and ACA branches.
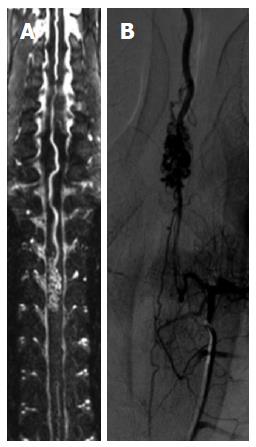
Figure 11 Spinal MRA.
A spinal magnetic resonance (MR) angiography (A) with a long field of view demonstrates an AVM of the anterior spinal artery that is also shown by spinal DSA (B).
- Citation: Pereira VM, Vargas MI, Marcos A, Bijlenga P, Narata AP, Haller S, Lövblad KO. Diagnostic neuroradiology for the interventional neuroradiologist. World J Radiol 2013; 5(11): 386-397
- URL: https://www.wjgnet.com/1949-8470/full/v5/i11/386.htm
- DOI: https://dx.doi.org/10.4329/wjr.v5.i11.386


