Copyright
©2012 Baishideng Publishing Group Co.
World J Radiol. Jul 28, 2012; 4(7): 335-340
Published online Jul 28, 2012. doi: 10.4329/wjr.v4.i7.335
Published online Jul 28, 2012. doi: 10.4329/wjr.v4.i7.335
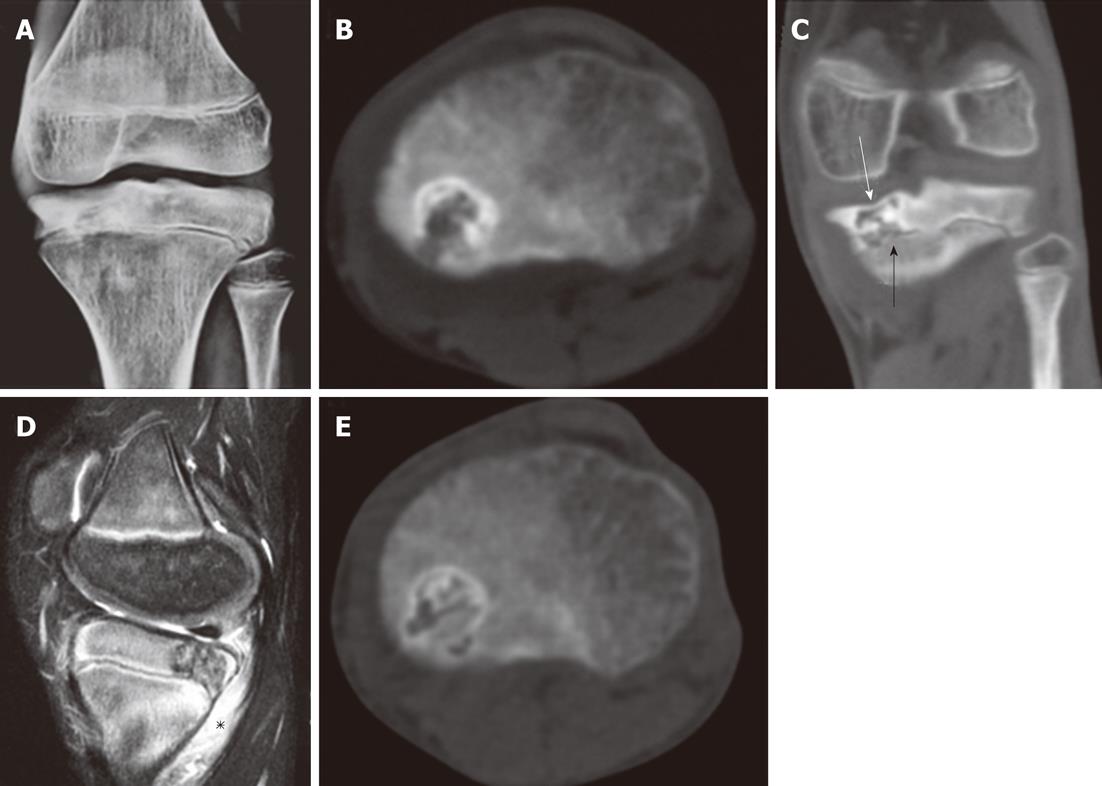
Figure 1 Chondroblastoma of the left tibia in a 14-year-old male.
A, B: Plain radiograph and non-contrast computed tomography (NCCT) axial image show a geographic lytic lesion with sclerotic margins and foci of matrix calcification in the medial tibial epiphysis; C: NCCT coronal image shows thinning of the subchondral bone superiorly (white arrow) and extension of the lesion to thephyseal plate inferiorly (black arrow) which is non-fused; D: Sagittal short-tau inversion-recovery magnetic resonance (MR) image showing heterogeneous signal intensity of the lesion with surrounding bone marrow and soft tissue oedema (asterisk); E: Follow-up CT image after 6 mo showing increased mineralization of the matrix with no appreciable change in lesion size.
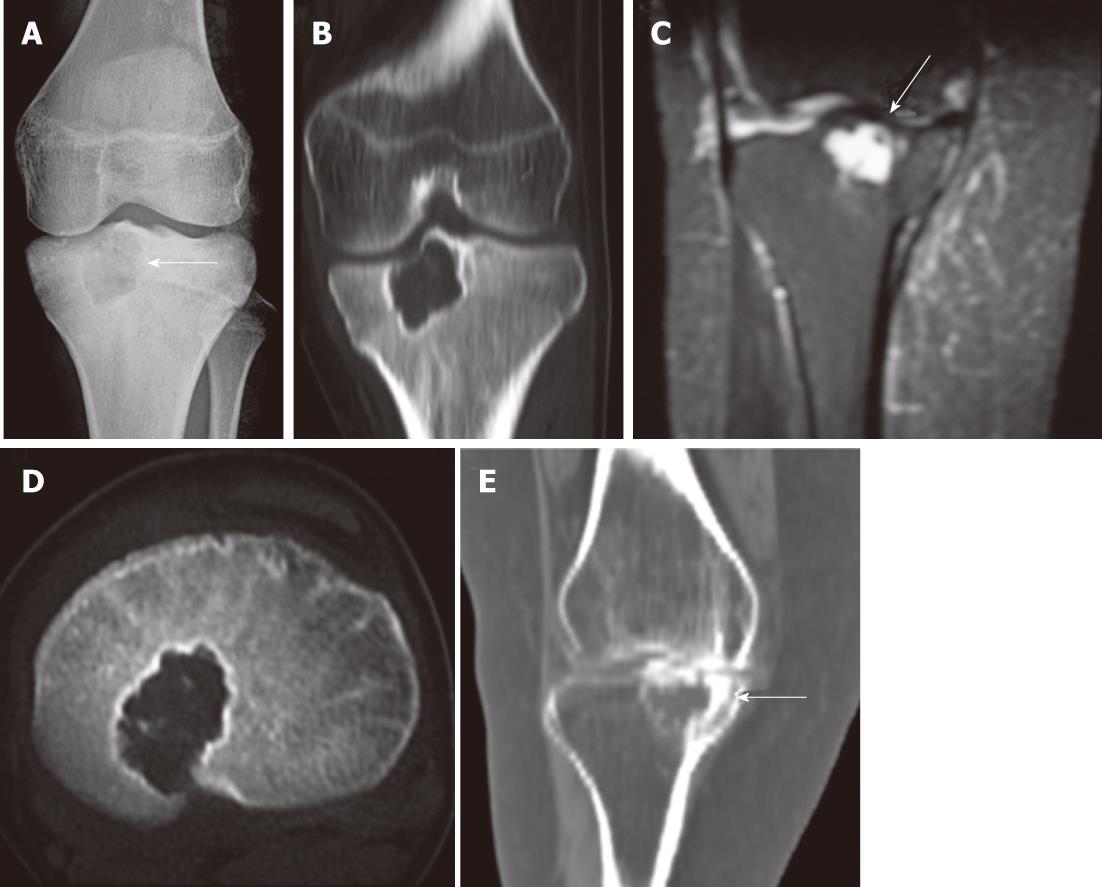
Figure 2 Chondroblastoma of the left tibia in a 13-year-old female.
A, B: Frontal radiograph and axial computed tomography (CT) image of the left knee showing a geographic lytic lesion with sclerotic margins (arrow) involving the proximal epiphysis of the tibia; C: Coronal non-contrast computed resonance image showing the lesion with thinning of the subchondral bone superiorly (arrow) and extension of the lesion into the metaphysis inferiorly; D: CT image obtained at the time of the procedure showing the radiofrequency electrode placed in the lesion. Access tracks from a prior biopsy are also seen; E: Follow-up image after 6 mo showing increased mineralizaion of the matrix with no appreciable change in lesion size.
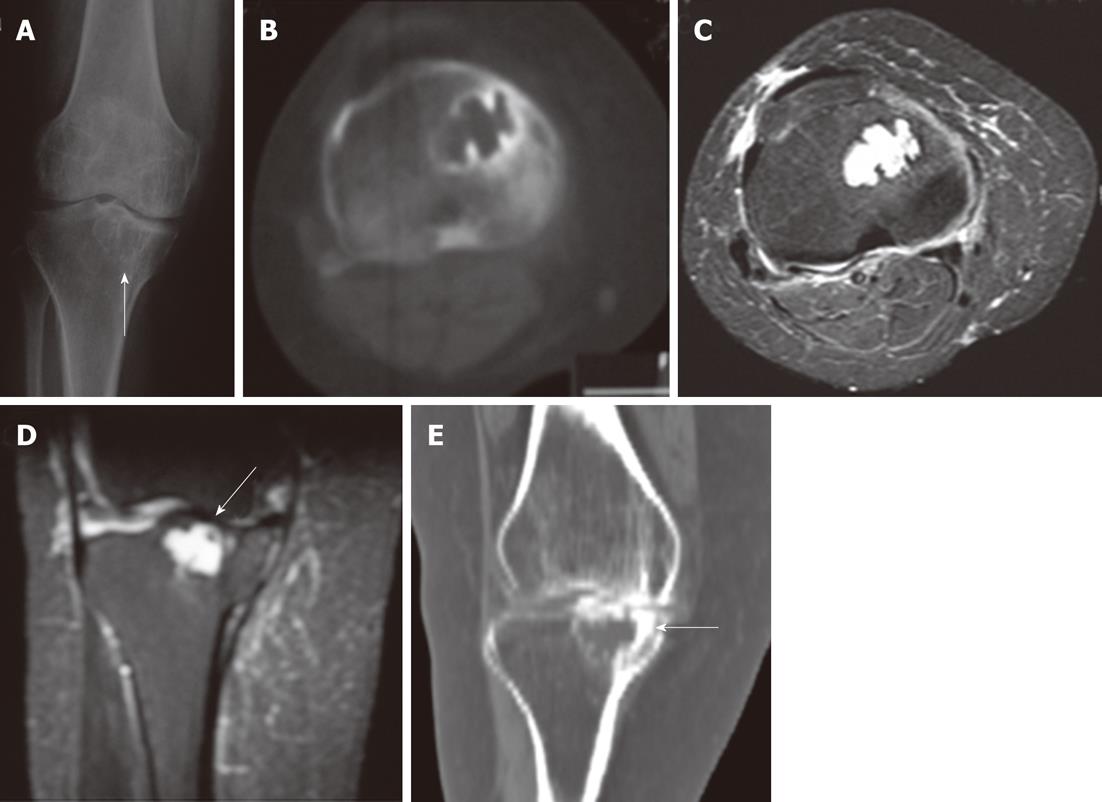
Figure 3 Chondroblastoma of the right tibia in a 55-year-old female.
A: Frontal radiograph of the right knee showing an ill-defined lytic lesion in the proximal epiphysis of the right tibia (arrow); B: Unenhanced axial computed tomography (CT) image shows to a better advantage the geographic lytic lesion with sclerotic margins. No matrix mineralization is seen; C, D: Axial and coronal short-tau inversion-recovery magnetic resonance image images showing that the lesion is homogeneously hyperintense and reaching upto the subarticular region causing thinning of the overlying subchondral bone (arrow); E: Follow-up CT image obtained after the second radiofrequency session showing increased peripheral sclerosis of the lesion (arrow) with no significant change in lesion size.
- Citation: Rajalakshmi P, Srivastava DN, Rastogi S, Julka PK, Bhatnagar S, Gamanagatti S. Bipolar radiofrequency ablation of tibialchondroblastomas: A report of three cases. World J Radiol 2012; 4(7): 335-340
- URL: https://www.wjgnet.com/1949-8470/full/v4/i7/335.htm
- DOI: https://dx.doi.org/10.4329/wjr.v4.i7.335


