Copyright
©2012 Baishideng Publishing Group Co.
World J Radiol. Nov 18, 2012; 4(11): 443-449
Published online Nov 18, 2012. doi: 10.4329/wjr.v4.i11.443
Published online Nov 18, 2012. doi: 10.4329/wjr.v4.i11.443
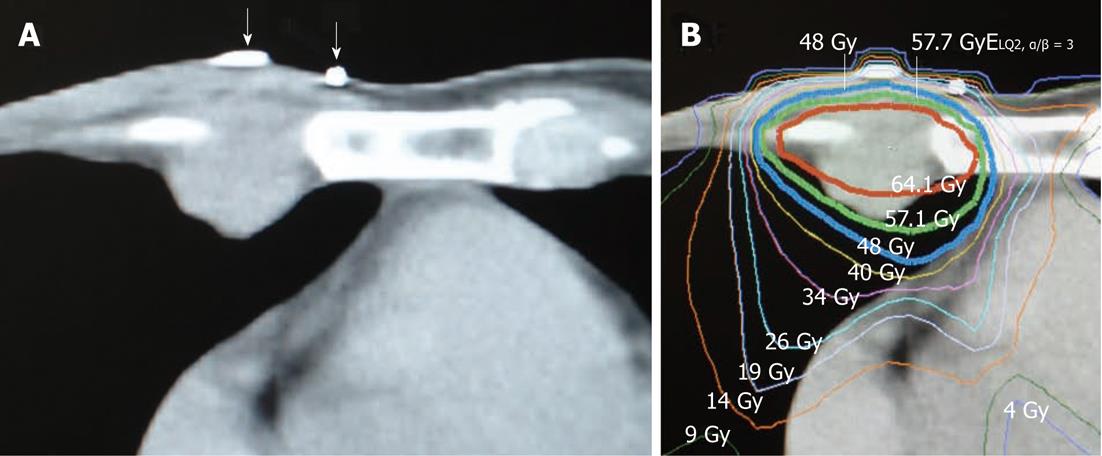
Figure 1 X-ray computed tomography images before radiotherapy and external beam radiotherapy treatment plan.
A: A lesion typical of internal mammary lymph node metastasis is observed, with no skin involvement; B: External beam therapy plan on the same slice. Subdermal dose at depth of 5 mm, epidermal dose, and dermal dose at depth of 2.5 mm was 57.1 Gy, 40 Gy and 48 Gy EQD2, α/β = 3, respectively, and 8-9.3 Gy (17.6-22.9 Gy-EQD2, α/β = 3). Isodose curves are 98% and 90% to 10% at intervals of 10% of 60 Gy, from innermost to outermost. White arrows: Positional markers for external beam radiotherapy simulation.
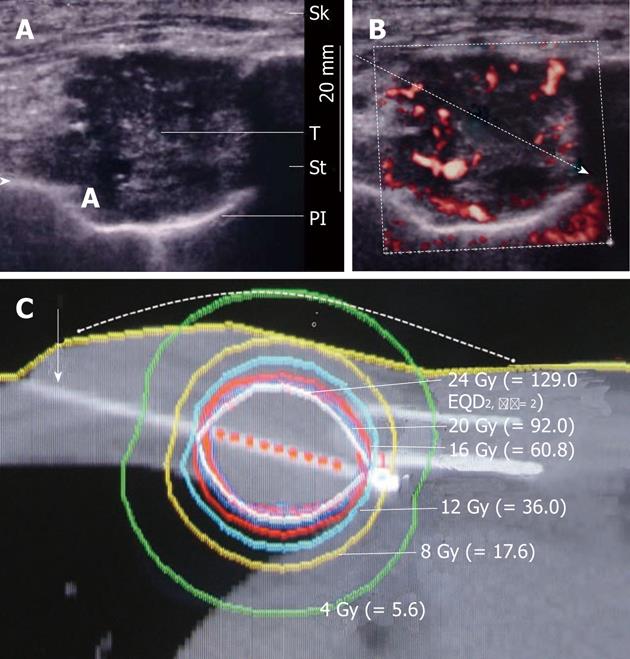
Figure 2 Plain ultrasound image (A) and power Doppler image showing the planned route for needle insertion to avoid vessels, pleura and lung (B): Brachytherapy dose distribution and inserted brachytherapy needle (white arrow) with nine red points (interval: 2.
5 mm) for source activation. The dashed line shows a supposed skin surface line raised by 7.0 mm and a single dot and a circle show the shifted dermal and subdermal reference point, respectively (C). The skin density is increased by subcutaneous injection of lidocaine, not by skin invasion. Dotted circle indicates planning target volume contour. Isodose curves are 150% (white), 125% (blue), 100% (red), 75% (light blue), 50% (yellow) and 25% (green) of 16 Gy, from innermost to outermost. Sk: Skin; T: Tumor; St: Sternum; Pl: Pleura.
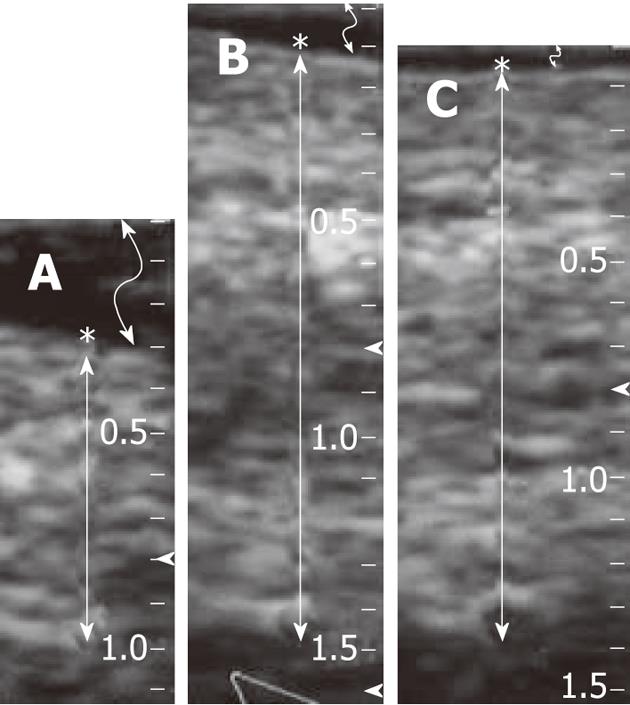
Figure 3 Measurement of skin thickness: The skin thickness from the epidermis to the bottom of the subdermis was approximately 7 mm before the gel injection (A), approx.
Fourteen mm after gel injection (B) and the thickness almost remained the same after irradiation (C). Slight decrease in the thickness might be due to compression by the probe. A low echogenic gel area is seen in the mid zone of the subcutaneous tissue including bright spots of air bubbles (B and C). Asterisk: Skin surface (epidermis); While arrow: Range of skin including epidermis, dermis and subdermis; Curved arrow: A gel layer between the surface of the skin and the ultrasonography probe (top), which surface gel was for a precise measurement avoiding compression.
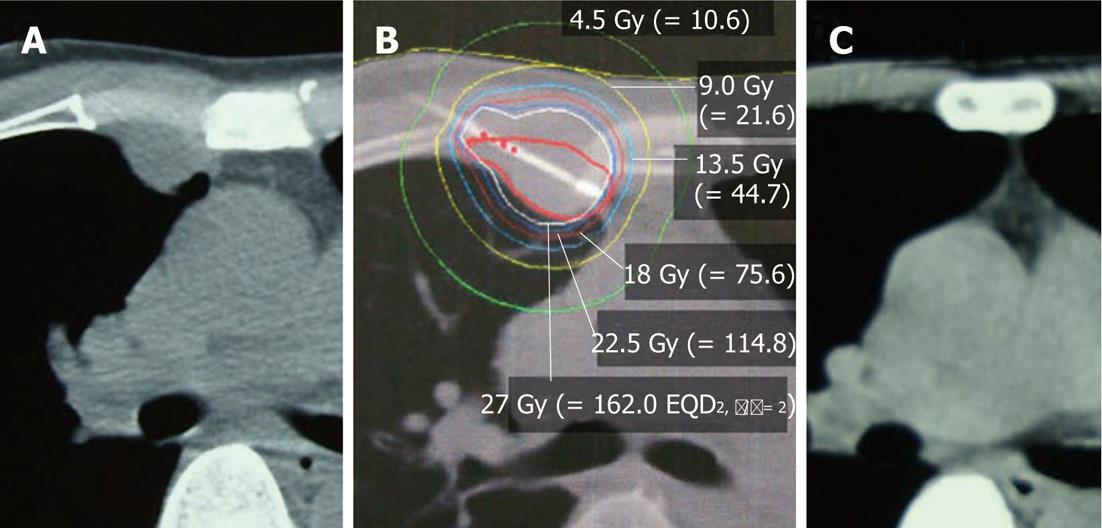
Figure 4 X-ray computed tomography (A) and brachytherapy dose distribution (B) images of the second lesion.
Computed tomography image shows no tumor recurrence at 1 year after treatment (C). The attachment pattern of the anterior mediastinum changed with breath holding. In images (A) and (B), slices were obtained at the maximal cross-section of the tumor. Isodose curves are 150%, 125% (thin line), 100% (18 Gy), 75%, 50% and 25%, from innermost to outermost.
Figure 5 X-ray computed tomography images obtained 2 years after the first treatment show no tumor recurrence (A, B) and no pulmonary injury except a tiny fleck (A), no skin damage is observed except for slight pigmentation due to EBRT (C).
- Citation: Kishi K, Tanino H, Sonomura T, Shirai S, Noda Y, Sato M, Okamura Y. Novel eradicative high-dose rate brachytherapy for internal mammary lymph node metastasis from breast cancer. World J Radiol 2012; 4(11): 443-449
- URL: https://www.wjgnet.com/1949-8470/full/v4/i11/443.htm
- DOI: https://dx.doi.org/10.4329/wjr.v4.i11.443


