Copyright
©2012 Baishideng Publishing Group Co.
World J Radiol. Oct 28, 2012; 4(10): 439-442
Published online Oct 28, 2012. doi: 10.4329/wjr.v4.i10.439
Published online Oct 28, 2012. doi: 10.4329/wjr.v4.i10.439
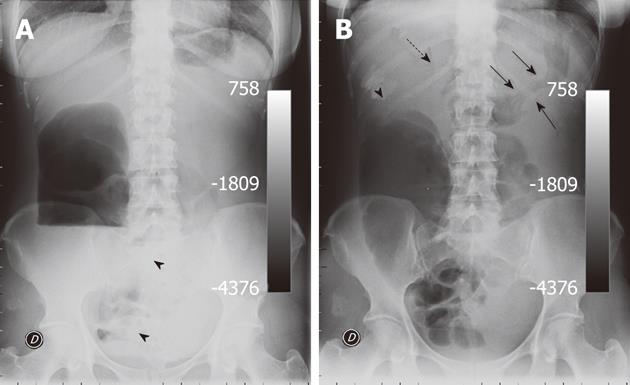
Figure 1 Abdominal plain films obtained in the upright (A) and supine position (B).
A: A huge air-fluid level is depicted in the right flank consistent with the obstruction of the ascending colon. Some air-fluid levels can also be appreciated in the middle abdomen and in the right iliac fossa (arrowheads) whereas both the left flank and ipsilateral iliac fossa appeared gasless; B: The ascending colon appears abnormally dilated and there seems to be fecal impaction in the sub-hepatic space (arrowhead). Ab-extrinsic printing is also evident on both sides of the gastric body (arrows). Retrospectively, air bubbles can also be appreciated at the level of the hepatic hilum (dash arrow).
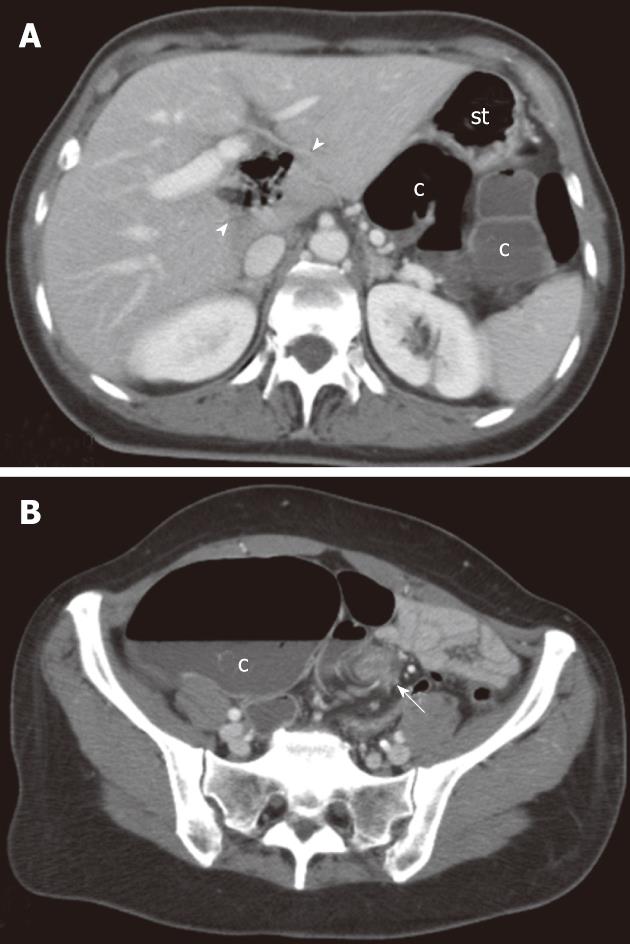
Figure 2 Multi-detector contrast-enhanced computed tomography.
Transverse images at the level of the upper abdomen (A) and the pelvis (B) are shown. A: A gas-containing loop is clearly depicted within the hepatic hilum (arrowheads) along with the evidence of a colonic segment (c) situated behind the stomach (st); B: An abnormally dilated colonic segment misinterpreted on the axial plane as cecum (c) can be appreciated in the right iliac fossa whereas torsion of the mesenteric vascular axis (whirl sign) is clearly depicted in the left iliac fossa (arrow).
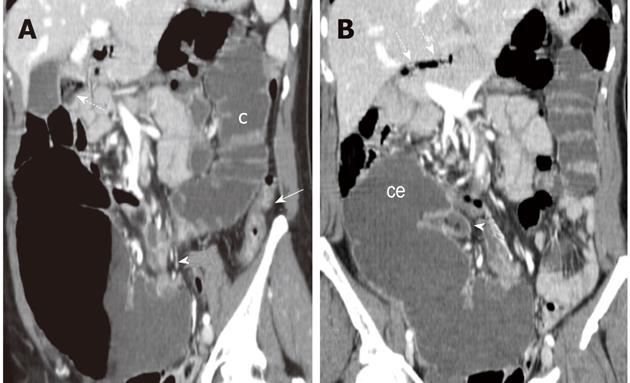
Figure 3 Multi-detector contrast-enhanced computed tomography.
Reformatted images on an oblique coronal (A) and on the coronal plane (B) are shown. In A, colonic segments (c) distal to the transition zone (arrowhead) also appeared distended by fluid throughout the splenic flexure with a collapsed descending colon (arrow). Signs of fecal reflux can be appreciated besides the gall-bladder (dash arrow) accounting for the mottled appearance depicted in the sub-hepatic space on the plain film series (B). On the coronal plane (B), the cecum (ce) appears tilted in the sub-hepatic space as it can be appreciated by the location of the terminal ileum (arrowhead) which also exhibits signs of fecal reflux, dash arrows indicate gas bubbles at the level of the hepatic hilum.
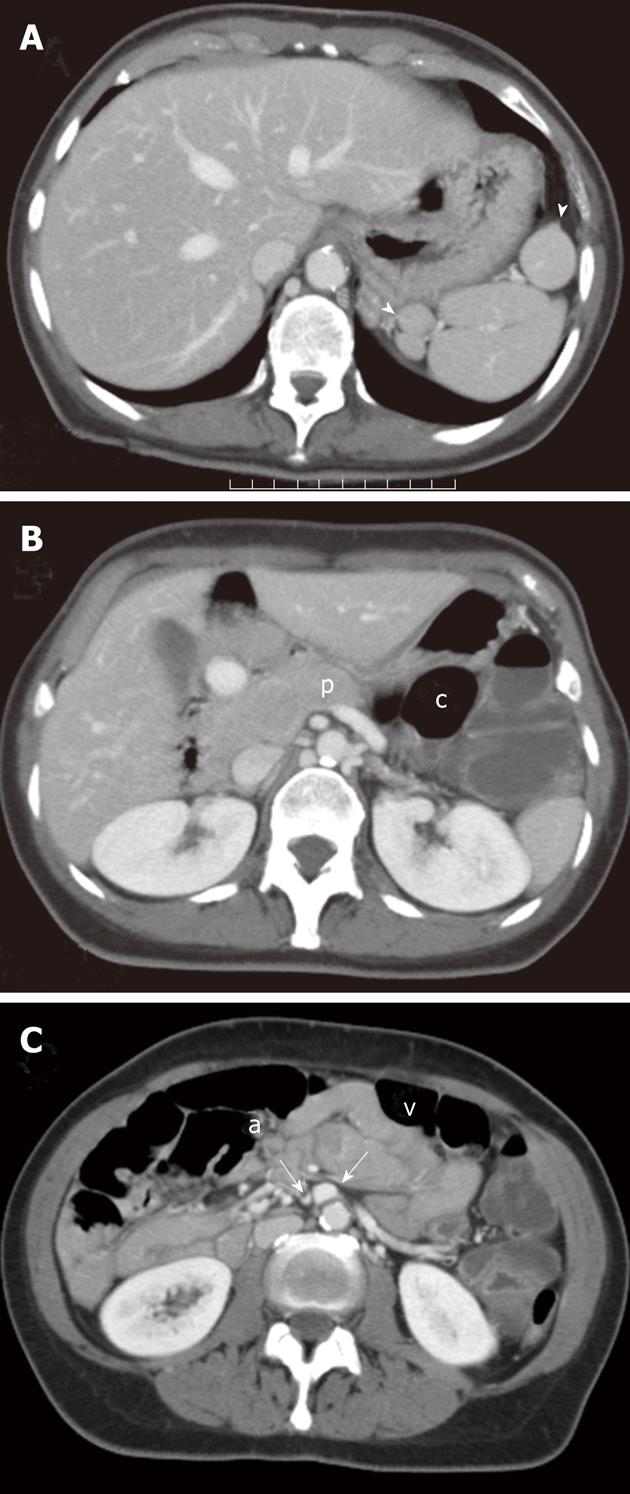
Figure 4 Multi-detector contrast-enhanced computed tomography.
Transverse images at the level of the upper (A and B) and the middle abdomen (C) are shown. Retrospective reading of computed tomography images revealed multiple splenic nodules (arrowheads) in the left sub-phrenic space (A) as well as a truncated appearance of the pancreatic body (p) (B) and an inverted anatomic relationship between the mesenteric superior artery (a) and vein (v) (C). c: Colon.
- Citation: Camera L, Calabrese M, Mainenti PP, Masone S, Vecchio WD, Persico G, Salvatore M. Volvulus of the ascending colon in a non-rotated midgut: Plain film and MDCT findings. World J Radiol 2012; 4(10): 439-442
- URL: https://www.wjgnet.com/1949-8470/full/v4/i10/439.htm
- DOI: https://dx.doi.org/10.4329/wjr.v4.i10.439


