Copyright
©2011 Baishideng Publishing Group Co.
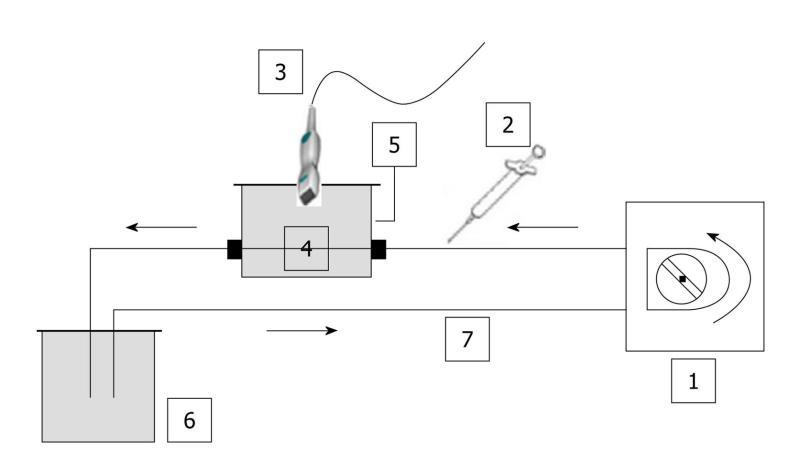
Figure 1 Schematic diagram of the closed-circuit.
No contact with ambient air was possible. In addition, as water was degassed, no significant amount of gas was trapped in the circuit. Based on the same set-up, three phantoms were used throughout the in vitro experiments: (a) a single straight pipe phantom; (b) a three intertwined pipe phantom; (c) a dialyzer. The Gustave Roussy Institute (IGR) ratio was tested throughout the in vitro experiments as it corresponded to the ratio (4.8 mL per patient) previously validated and routinely used at the IGR. 1: Peristaltic pump; 2: Syringe; 3: PZT, PLT 604AT probe; 4: Phantom; 5: Custom-made water tank; 6: Reservoir; 7: Tubing (silicone pipe; internal diameter: 2 mm; wall thickness: 1 mm).
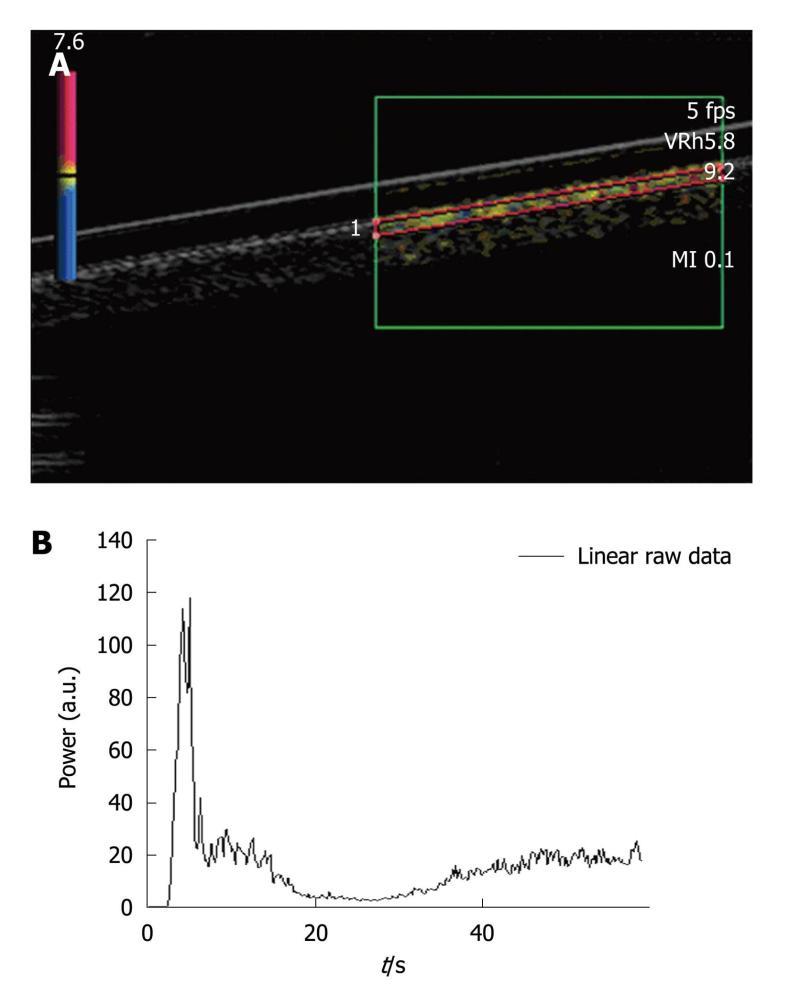
Figure 2 Single straight pipe phantom.
A: Image extracted from an acquisition obtained after the bolus injection of SonoVue®. Harmonic imaging was done based on the Vascular Recognition Imaging mode. The region of interest was set in the upper part of the pipe. Each acquisition involved a new manually drawn region of interest. Once the region of interest was selected, the ultrasound scanner directly allowed access to the time intensity curve associated with the selected region of interest. The linear raw data to be modeled were converted through text files generated by the ultrasound scanner and extracted to obtain a graph using Excel®; B: The graph displays the Excel® curve to be fitted and analyzed in order to obtain the perfusion parameters.
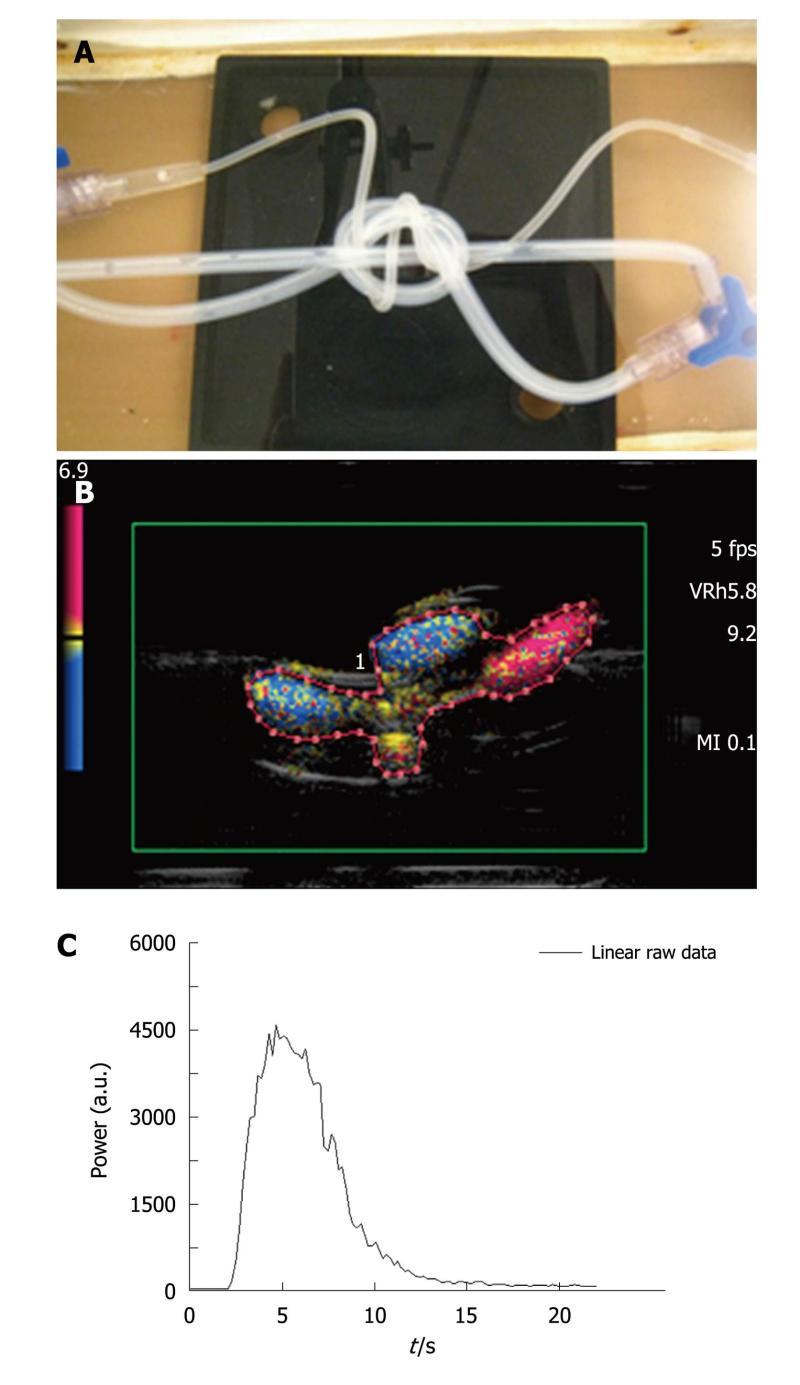
Figure 3 Three intertwined pipe phantom.
A: Picture of the phantom: three pipes (2 pipes with a 2 mm internal diameter and a 1 mm thick wall, 1 pipe with a 1 mm internal diameter and a 0.5 mm thick wall ) were intertwined to mimic a complex structure akin to that of vessels in the microvascularization; B: Image extracted from an acquisition obtained after a bolus injection of SonoVue®. As in the case of the first phantom, harmonic imaging was based on the Vascular Recognition Imaging mode. The region of interest contained both pipes and water and was manually drawn for each of the five injections; C: Based on the selected region of interest, the ultrasound scanner provided the time intensity curve converted through text files. These were used to display the associated Excel® curve to be analyzed.
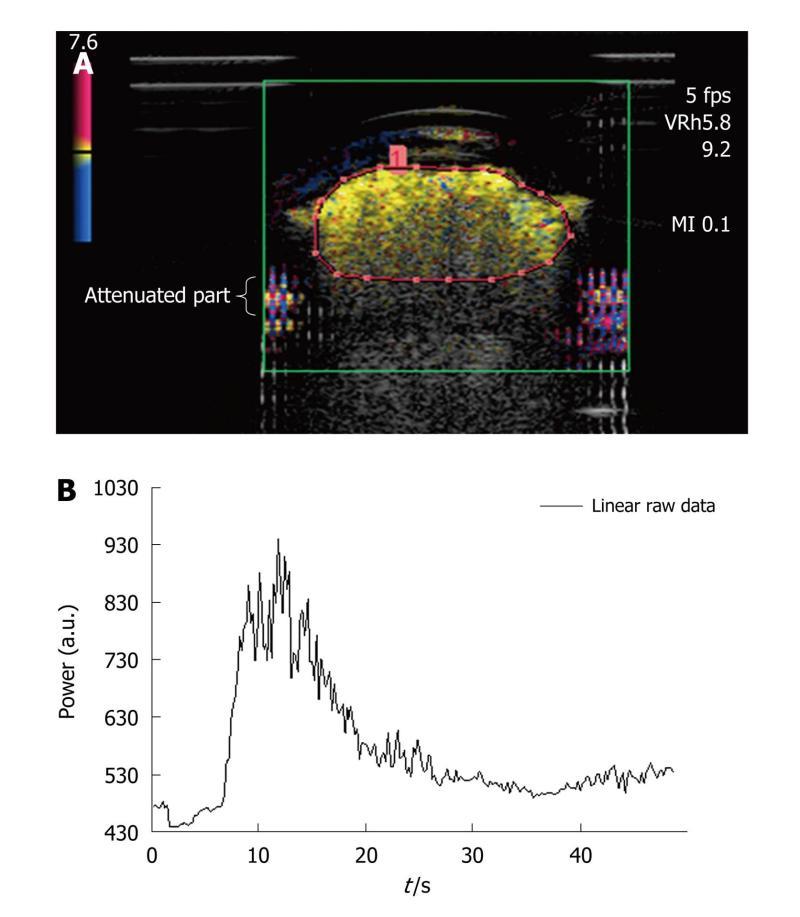
Figure 4 Dialyzer.
A: Image extracted from an acquisition obtained after a bolus injection of SonoVue®. As in the case of the first two phantoms, harmonic imaging was based on the Vascular Recognition Imaging mode. The region of interest contained the upper part of the dialyzer to avoid attenuation phenomena in the lower parts. This was manually drawn for each injection; B: To determine perfusion parameters from the time intensity curve obtained following the selection of the region of interest, this was converted through text files so that the analysis could be performed using the Solver program in Excel®.
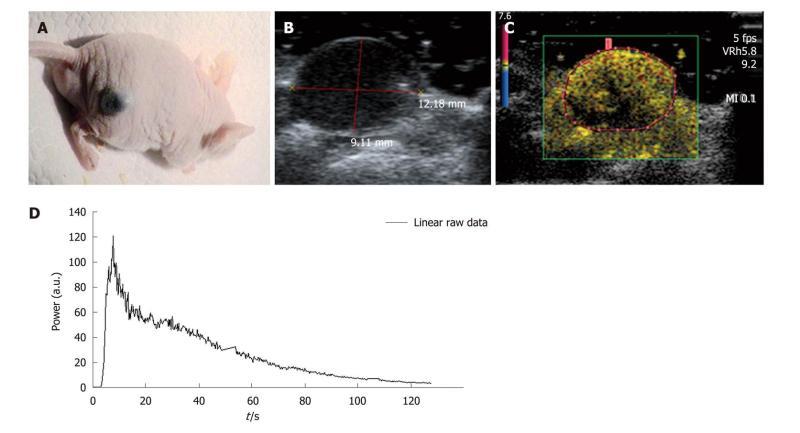
Figure 5 In vivo.
A: Experiments were conducted with nude female mice aged from 6 to 8 wk. The selected tumor model was the B16F10 melanoma cell line which is a murine skin cancer; B, C: The region of interest contained only the tumor and was drawn for each injection performed. If the image was not well defined using the harmonic mode, the B-mode image was used to correctly define the region of interest; D: As in the case of the in vitro experiments, the ultrasound scanner displayed the associated time intensity curve. This was extracted and converted through an Excel® file so that the analysis could be performed to obtain the required perfusion parameters.
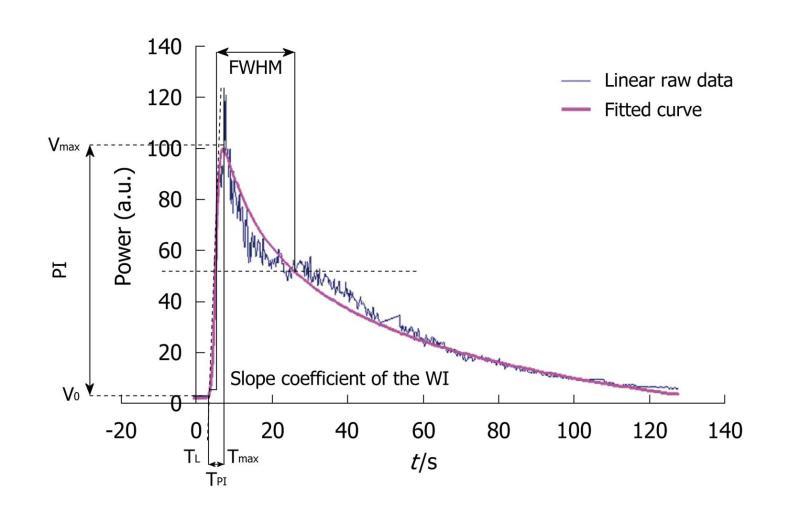
Figure 6 The graph displays an example of a time intensity curve with 4 of its 7 associated perfusion parameters: the peak intensity or peak intensity (difference between Vmax and V0), the time to peak intensity or time to peak intensity (the difference between Tmax and TL), the slope coefficient of the wash-in (the slope of the tangent of the wash-in at half maximum) and the full width at half maximum or FWHM (corresponding to a first approximation of the mean transit time).
The three other perfusion parameters extracted from the time intensity curve were the area under the curve, the area under the wash-in and the area under the wash-out. PI: Peak intensity; TPI: Time to peak intensity.
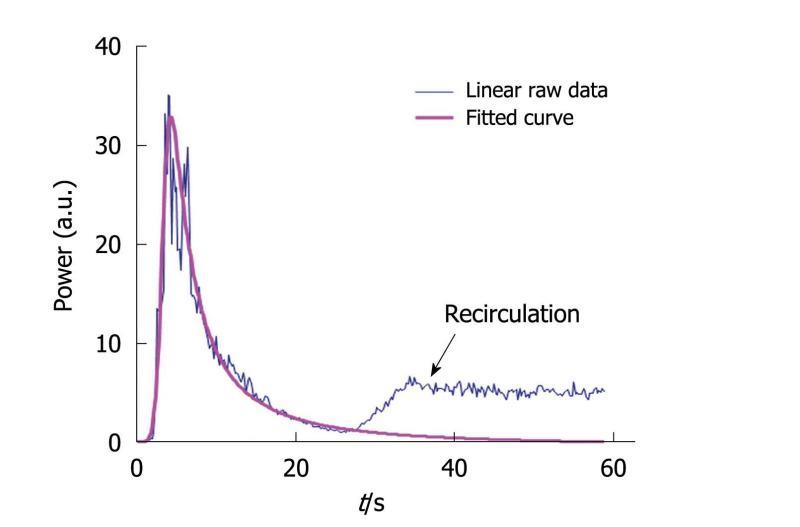
Figure 7 This graph displays both a time intensity curve and its associated fitted curve.
Recirculation is avoided through the modeling process so that the conditions required to apply the time intensity method are fulfilled: the Gustave Roussy Institute equation perfectly fits the wash-in part of the curve while the wash-out part is adjusted so that recirculation is not taken into account in the final fitted curve.
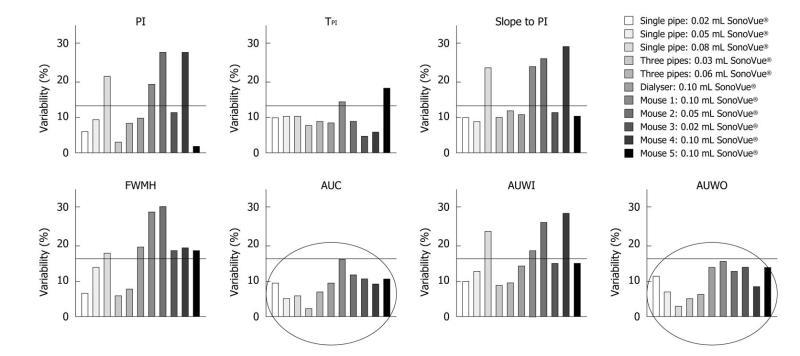
Figure 8 This graph shows the variability of perfusion parameters involved in both the in vitro and in vivo experiments.
Five injections were recorded for each of the three phantoms and three for each mouse. The results demonstrated less than 30% overall variability, whatever the perfusion parameter. CV: Coefficient of variation; PI: Peak intensity; TPI: Time to peak intensity; FWHM: Full width at half maximum; AUC: Area under the curve; AUWI: Area under the wash-in; AUWO: Area under the wash-out.
- Citation: Gauthier M, Leguerney I, Thalmensi J, Chebil M, Parisot S, Peronneau P, Roche A, Lassau N. Estimation of intra-operator variability in perfusion parameter measurements using DCE-US. World J Radiol 2011; 3(3): 70-81
- URL: https://www.wjgnet.com/1949-8470/full/v3/i3/70.htm
- DOI: https://dx.doi.org/10.4329/wjr.v3.i3.70


