Copyright
©2011 Baishideng Publishing Group Co.
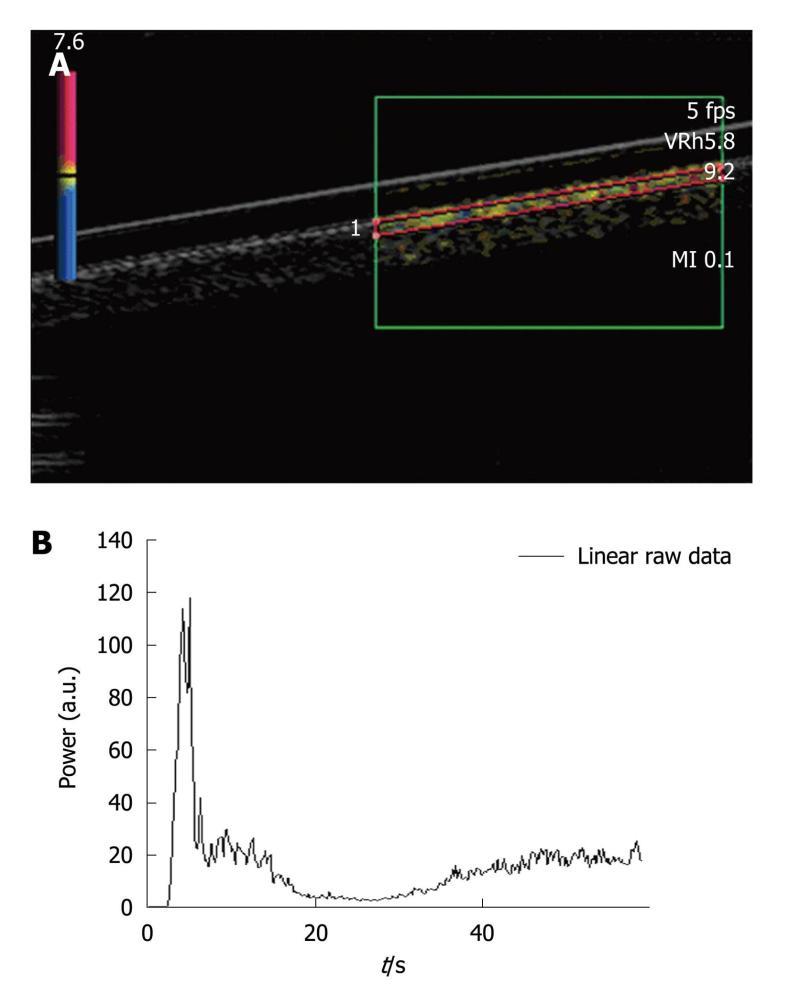
Figure 2 Single straight pipe phantom.
A: Image extracted from an acquisition obtained after the bolus injection of SonoVue®. Harmonic imaging was done based on the Vascular Recognition Imaging mode. The region of interest was set in the upper part of the pipe. Each acquisition involved a new manually drawn region of interest. Once the region of interest was selected, the ultrasound scanner directly allowed access to the time intensity curve associated with the selected region of interest. The linear raw data to be modeled were converted through text files generated by the ultrasound scanner and extracted to obtain a graph using Excel®; B: The graph displays the Excel® curve to be fitted and analyzed in order to obtain the perfusion parameters.
- Citation: Gauthier M, Leguerney I, Thalmensi J, Chebil M, Parisot S, Peronneau P, Roche A, Lassau N. Estimation of intra-operator variability in perfusion parameter measurements using DCE-US. World J Radiol 2011; 3(3): 70-81
- URL: https://www.wjgnet.com/1949-8470/full/v3/i3/70.htm
- DOI: https://dx.doi.org/10.4329/wjr.v3.i3.70


