Copyright
©2010 Baishideng Publishing Group Co.
World J Radiol. Apr 28, 2010; 2(4): 143-147
Published online Apr 28, 2010. doi: 10.4329/wjr.v2.i4.143
Published online Apr 28, 2010. doi: 10.4329/wjr.v2.i4.143
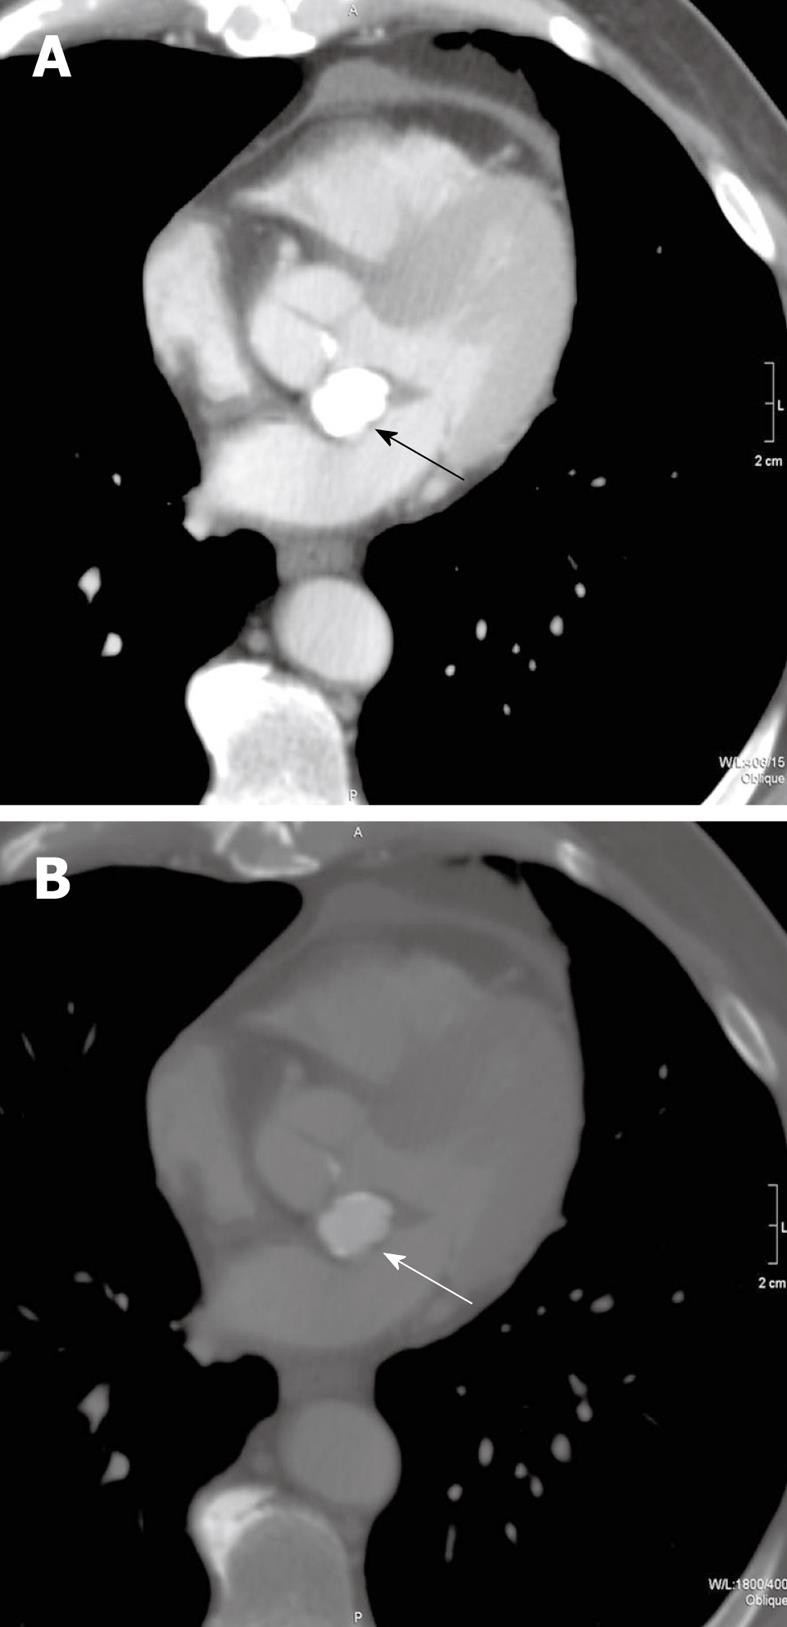
Figure 1 Transverse, non-gated, post-contrast CT images at a level through the heart with mediastinal (A) and bone (B) windows and level settings shown (kVp = 120, mAs = 214, DFOV = 314 mm).
Caseous mitral annular calcifications are noted in the aorto-atrial septum (arrows). On the mediastinal window and level settings, the mass shows homogeneous hyperattenuation which cannot be differentiated from other calcific structures. When the window and level settings are adjusted, there is a rim of peripheral calcification with central, homogeneous hyperattenuation. This mass was stable in comparison to CT scans before and after this study (not shown).
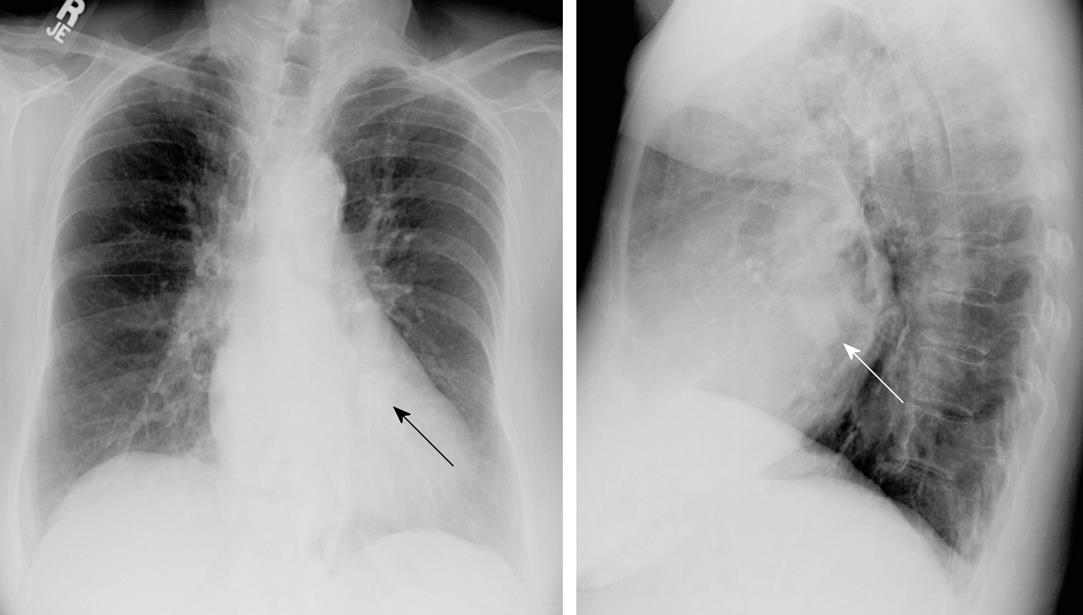
Figure 2 P-A (left) and lateral (right) views of the chest demonstrate an ovoid nodule overlying the cardiac silhouette on both views (arrows).
This was misinterpreted as a possible pulmonary nodule. On plain radiography, its nature is difficult to delineate.
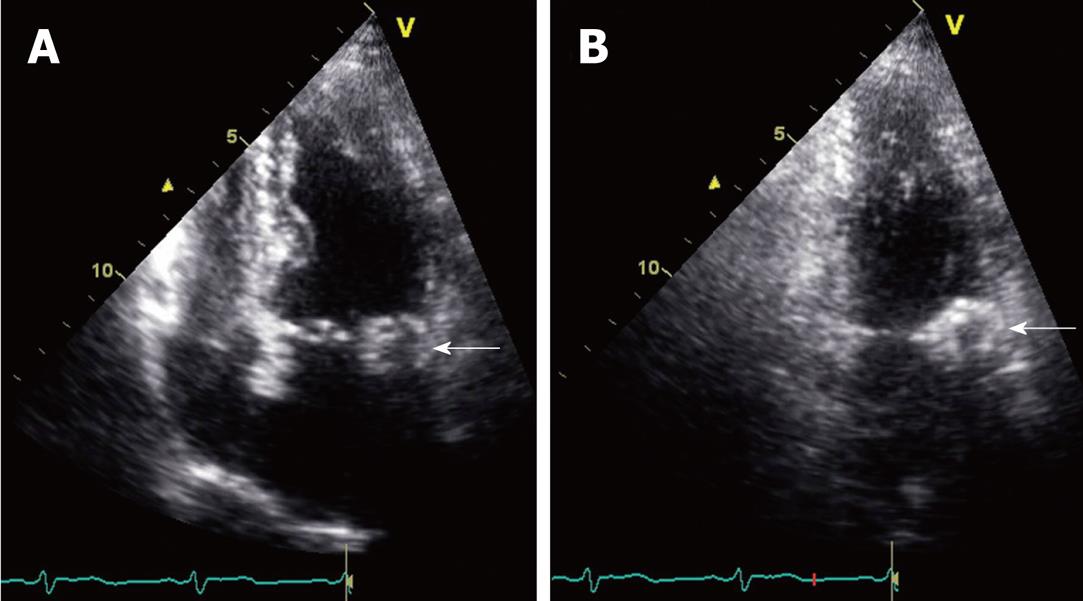
Figure 3 Slightly oblique four-chamber (A) and two-chamber (B) still frame images are obtained from an echocardiogram.
These views demonstrate a mass along the mitral annulus (white arrows). The caseous mitral annular calcifications are seen as an ovoid mass. A difference between the relatively echolucent center and the more echogenic periphery of this structure is perceptible. This is consistent with the centrally liquefied calcium and the peripheral more dense calcium observed on other modalities.
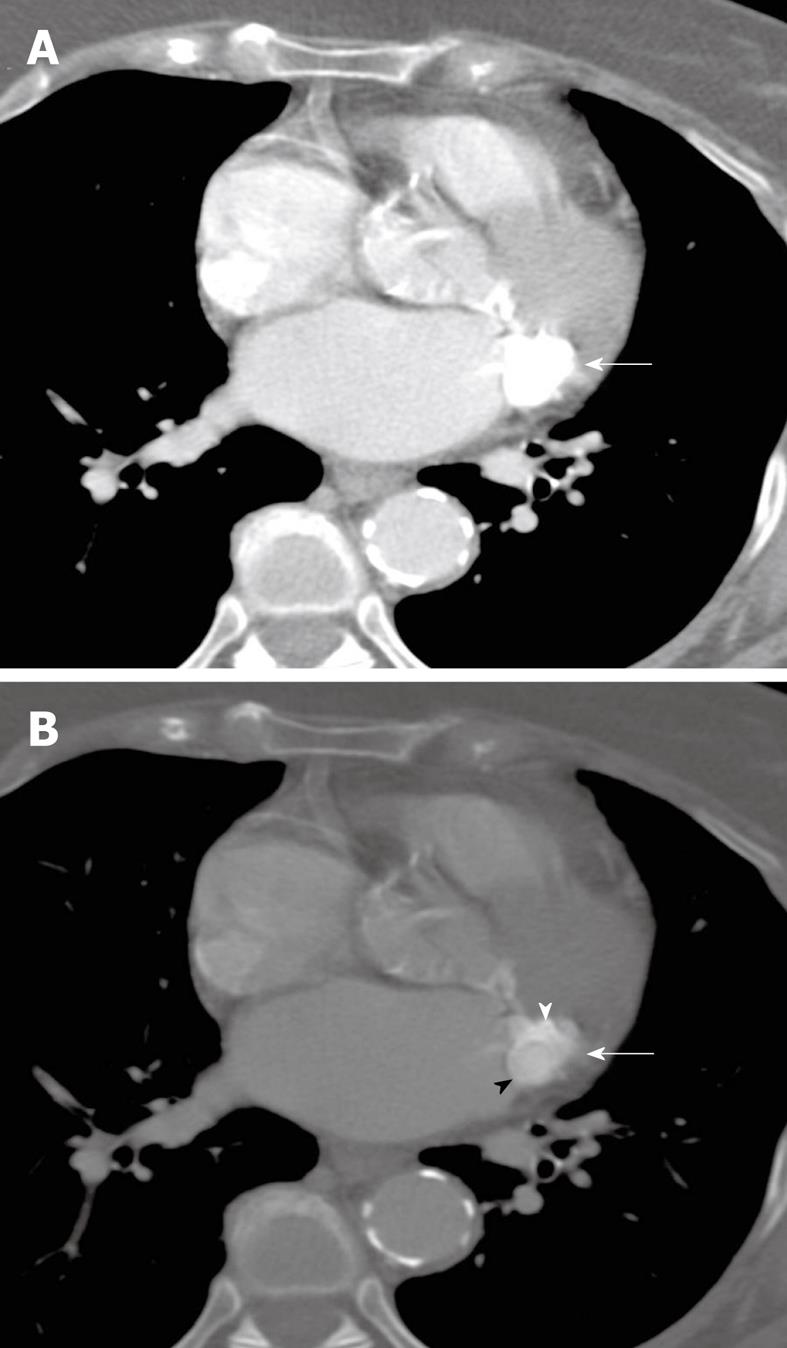
Figure 4 Transverse, non-gated, post-contrast CT images at a level through the heart are shown with mediastinal (A) and bone (B) windows and level settings (kVp = 120, mAs = 220, DFOV = 310 mm).
An ovoid mass of caseous mitral annular calcifications is seen high along the posterior portion of the mitral annular leaflet (white arrows). Although there is motion artifact, there is differing attenuation between the calcific rim of this structure (white arrowhead) and the central homogeneous liquefied calcium, which is slightly less hyperattenuating (black arrowhead). This difference is seen on the bone window image (B), but is not demonstrable on the mediastinal window/level settings (A). Based on correlation with the scout view (not shown), this was felt to be the cause of the nodule seen on plain radiography (Figure 3).
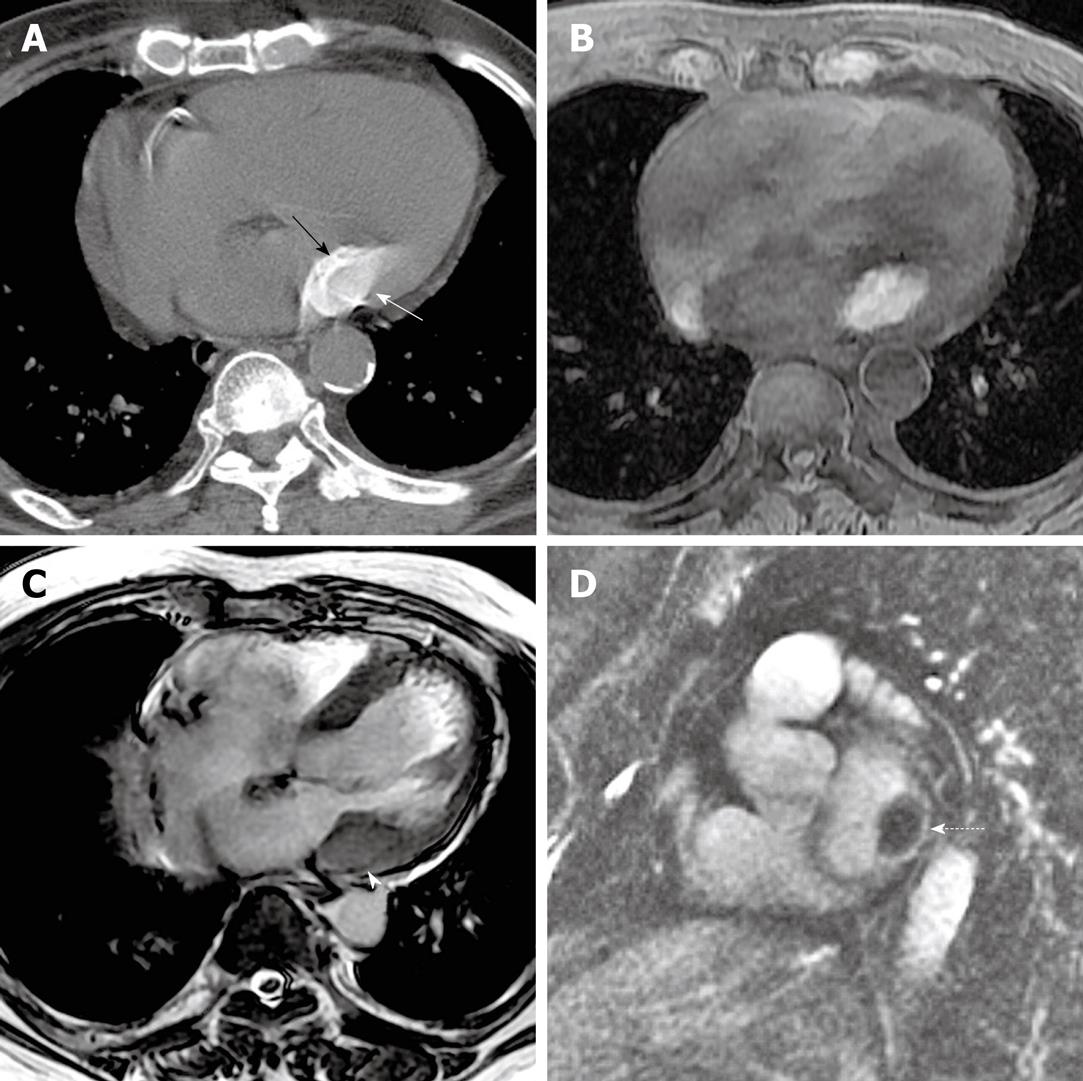
Figure 5 A non-contrast CT image (kVp = 120, mAs = 214, DFOV = 322 mm) (A) performed after the cardiac MRI demonstrates again, a homogeneously hyperattenuating structure in the posterolateral mitral annulus (white arrow) with a shell of calcification (black arrow).
This corresponded with a T1 hyperintense structure in the region of the mitral annulus (B) (TR = 5.28, TE = 2.55, FA = 12). On a screen capture from a cine balanced steady state free precession sequence, the mass shows low T2 signal (C) (TR = 3.19, TE = 1.15, FA = 40), although the shell of calcification around the mass is slightly lower in T2 intensity than the central portion of the mass (white arrowhead). A short axis, delayed enhancement, inversion recovery image (D) (TR = 4.39, TE = 1.26, FA = 13) shows central low signal intensity as well, although there is some peripheral delayed enhancement around the mass (dashed arrow).
Figure 6 In a different patient, not described herein, the more characteristic appearance of mitral annular calcifications is demonstrated (arrows).
These are seen on the P-A view (A), with window and level settings adjusted to better visualize the mitral annular calcifications. The typical C-shape of the mitral annular calcifications is also demonstrated on the lateral view (B) and on a non-contrast CT image through the level of the heart (C) (kVp = 120, mAs = 212, DFOV = 310 mm). Note the difference between the chunky, coarse, C-shaped calcifications seen in this patient and the ovoid, mass-like calcifications with liquefied calcium that we describe.
- Citation: Shriki J, Rongey C, Ghosh B, Daneshvar S, Colletti PM, Farvid A, Wilcox A. Caseous mitral annular calcifications: Multimodality imaging characteristics. World J Radiol 2010; 2(4): 143-147
- URL: https://www.wjgnet.com/1949-8470/full/v2/i4/143.htm
- DOI: https://dx.doi.org/10.4329/wjr.v2.i4.143


