Copyright
©2010 Baishideng Publishing Group Co.
World J Radiol. Apr 28, 2010; 2(4): 143-147
Published online Apr 28, 2010. doi: 10.4329/wjr.v2.i4.143
Published online Apr 28, 2010. doi: 10.4329/wjr.v2.i4.143
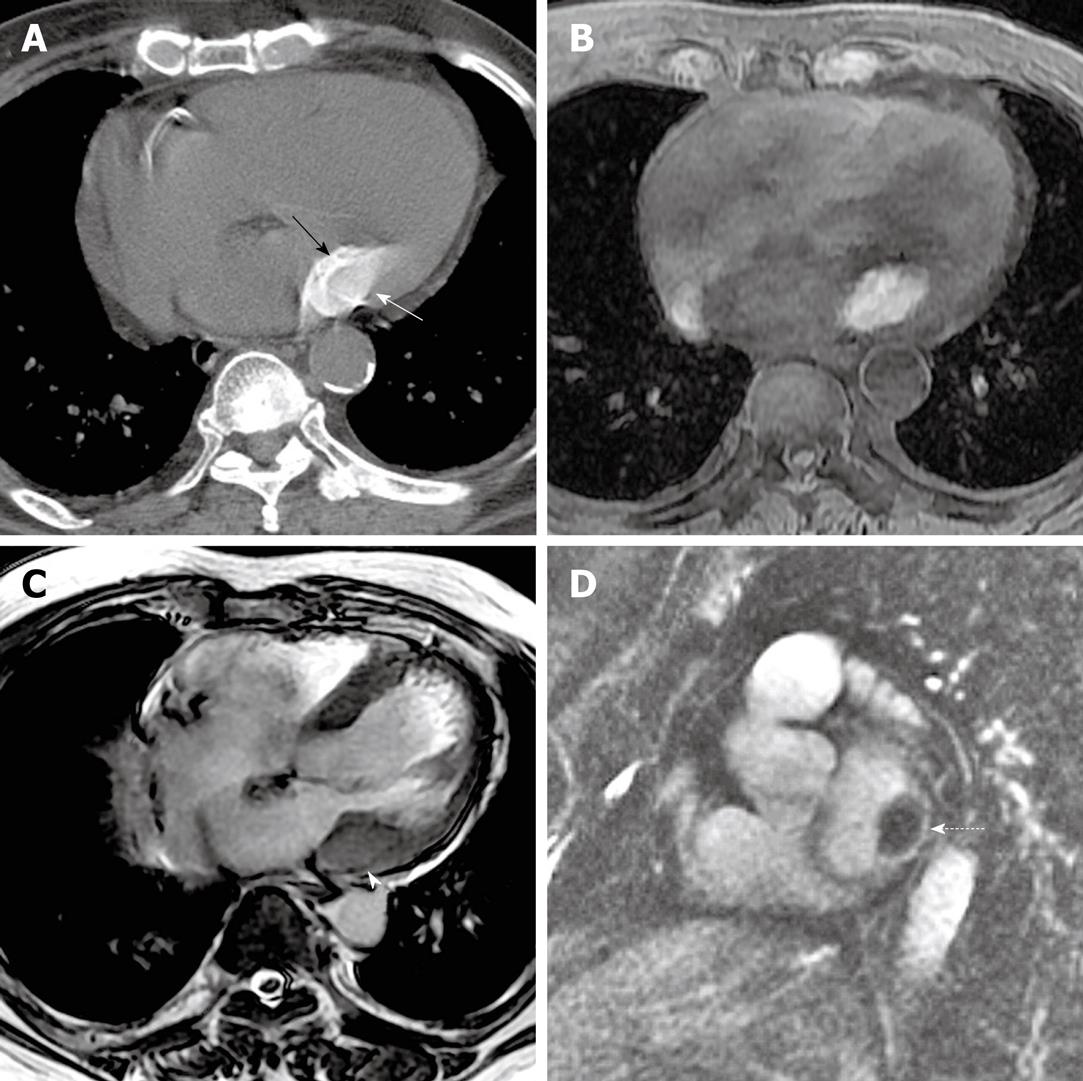
Figure 5 A non-contrast CT image (kVp = 120, mAs = 214, DFOV = 322 mm) (A) performed after the cardiac MRI demonstrates again, a homogeneously hyperattenuating structure in the posterolateral mitral annulus (white arrow) with a shell of calcification (black arrow).
This corresponded with a T1 hyperintense structure in the region of the mitral annulus (B) (TR = 5.28, TE = 2.55, FA = 12). On a screen capture from a cine balanced steady state free precession sequence, the mass shows low T2 signal (C) (TR = 3.19, TE = 1.15, FA = 40), although the shell of calcification around the mass is slightly lower in T2 intensity than the central portion of the mass (white arrowhead). A short axis, delayed enhancement, inversion recovery image (D) (TR = 4.39, TE = 1.26, FA = 13) shows central low signal intensity as well, although there is some peripheral delayed enhancement around the mass (dashed arrow).
- Citation: Shriki J, Rongey C, Ghosh B, Daneshvar S, Colletti PM, Farvid A, Wilcox A. Caseous mitral annular calcifications: Multimodality imaging characteristics. World J Radiol 2010; 2(4): 143-147
- URL: https://www.wjgnet.com/1949-8470/full/v2/i4/143.htm
- DOI: https://dx.doi.org/10.4329/wjr.v2.i4.143


