Copyright
©The Author(s) 2025.
World J Radiol. Aug 28, 2025; 17(8): 109146
Published online Aug 28, 2025. doi: 10.4329/wjr.v17.i8.109146
Published online Aug 28, 2025. doi: 10.4329/wjr.v17.i8.109146
Figure 1 Follow-up treatment after the use of adalimumab.
A: It shows the presence of effusion as indicated by the color map in B-mode; B: It shows the absence of effusion (arrows). They illustrate the longitudinal dorsal recess of the second proximal interphalangeal joint with peritendinitis.
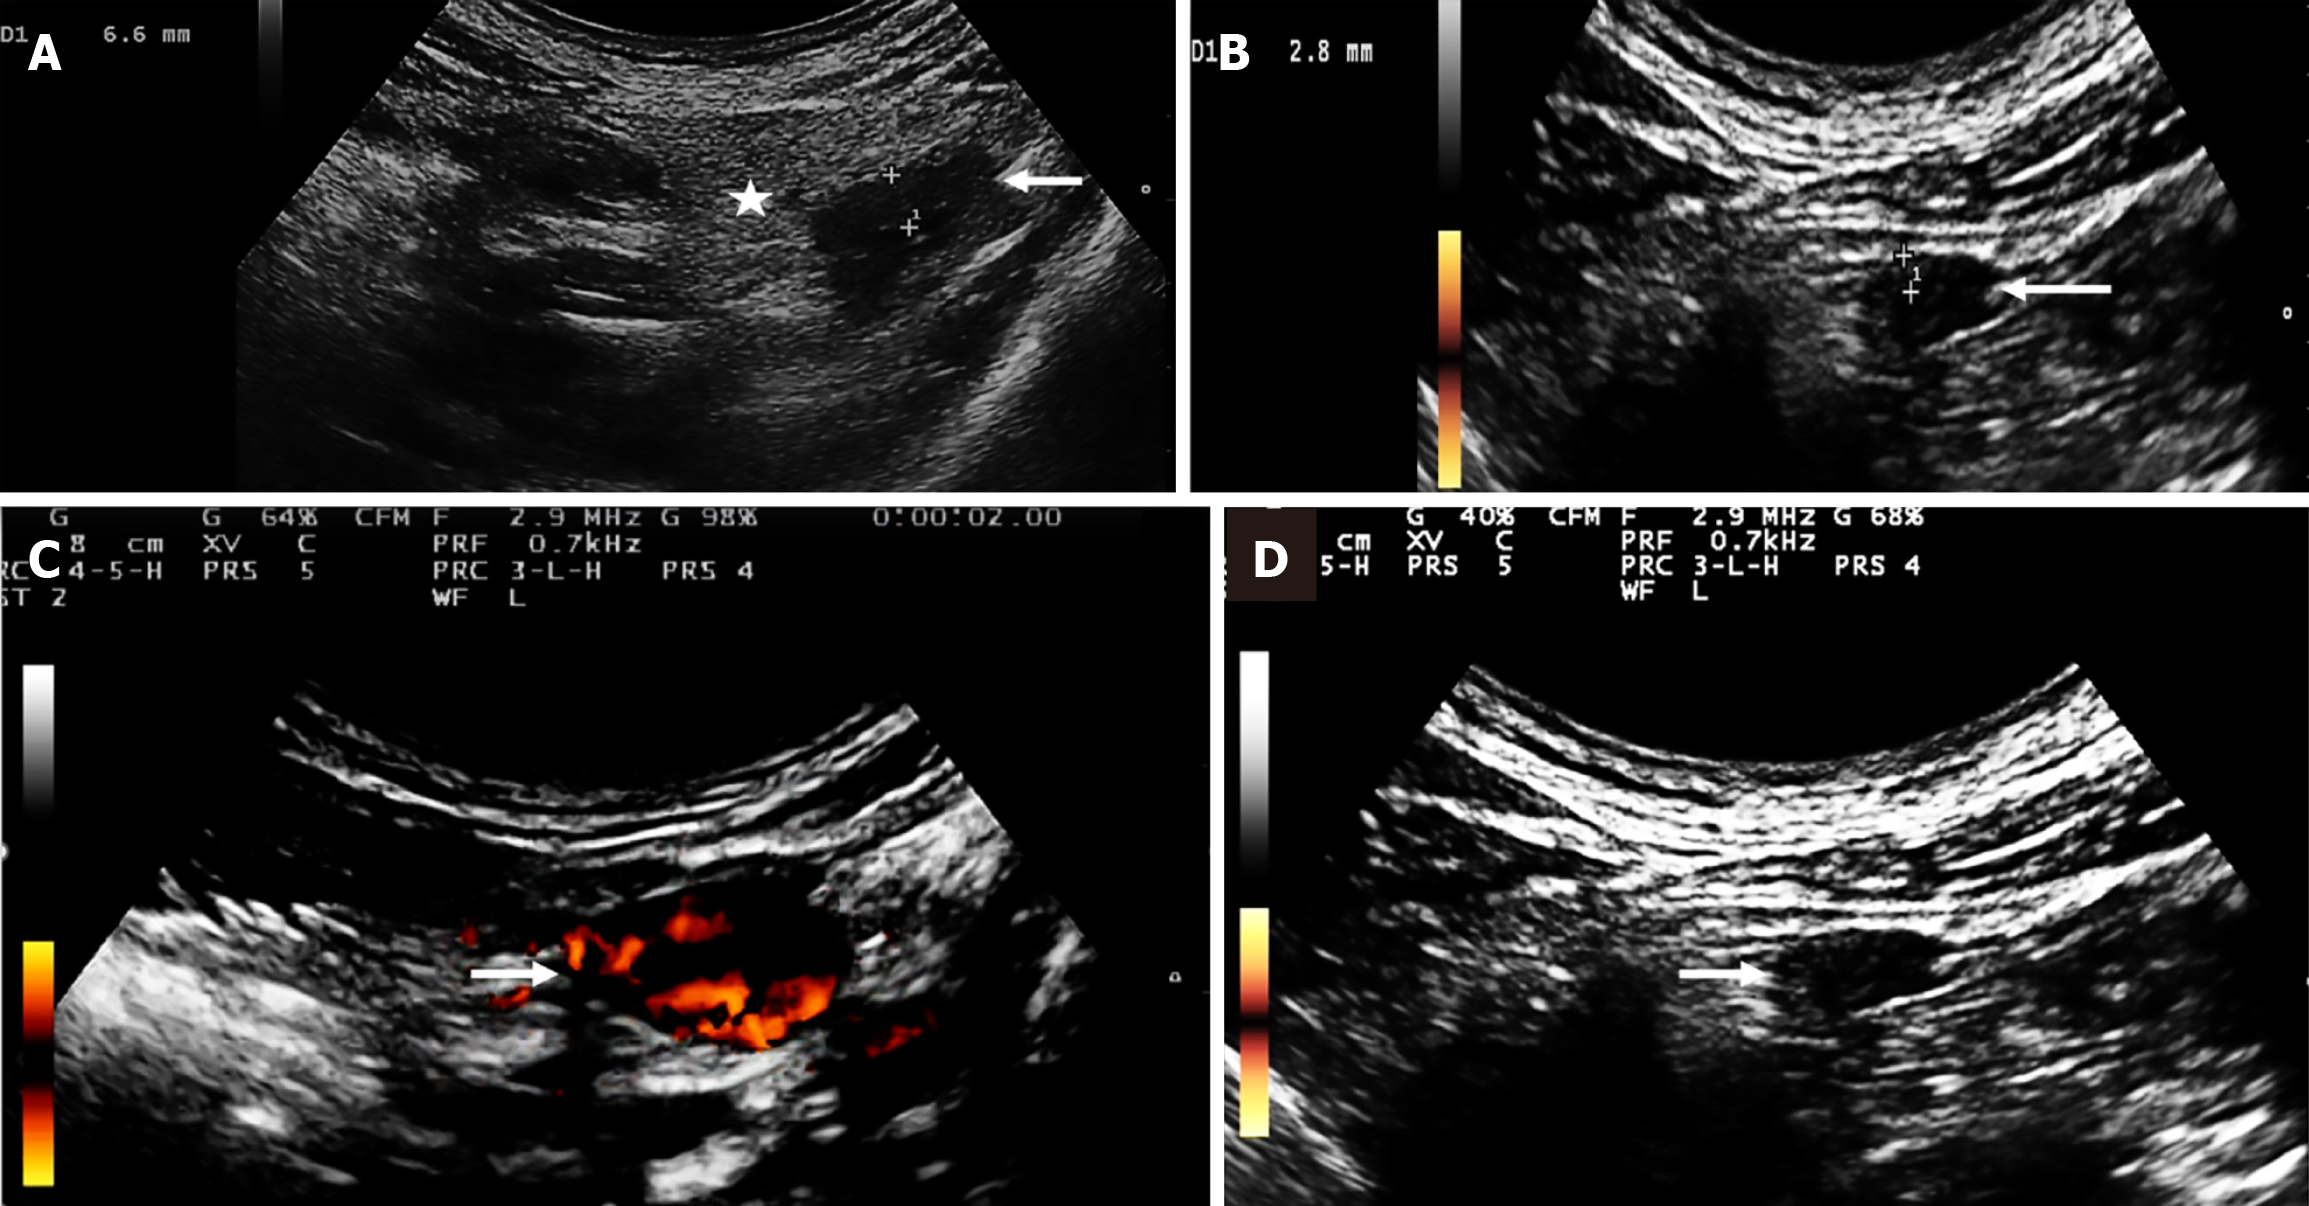
Figure 2 Monitoring intestinal inflammatory activity: Improvement after adalimumab treatment.
A and B: Reduced intestinal wall thickening (arrows) and perienteric fat (star) (short axis images of the sigmoid colon); C and D: Decreased Doppler signal per the Limberg scale (arrows).
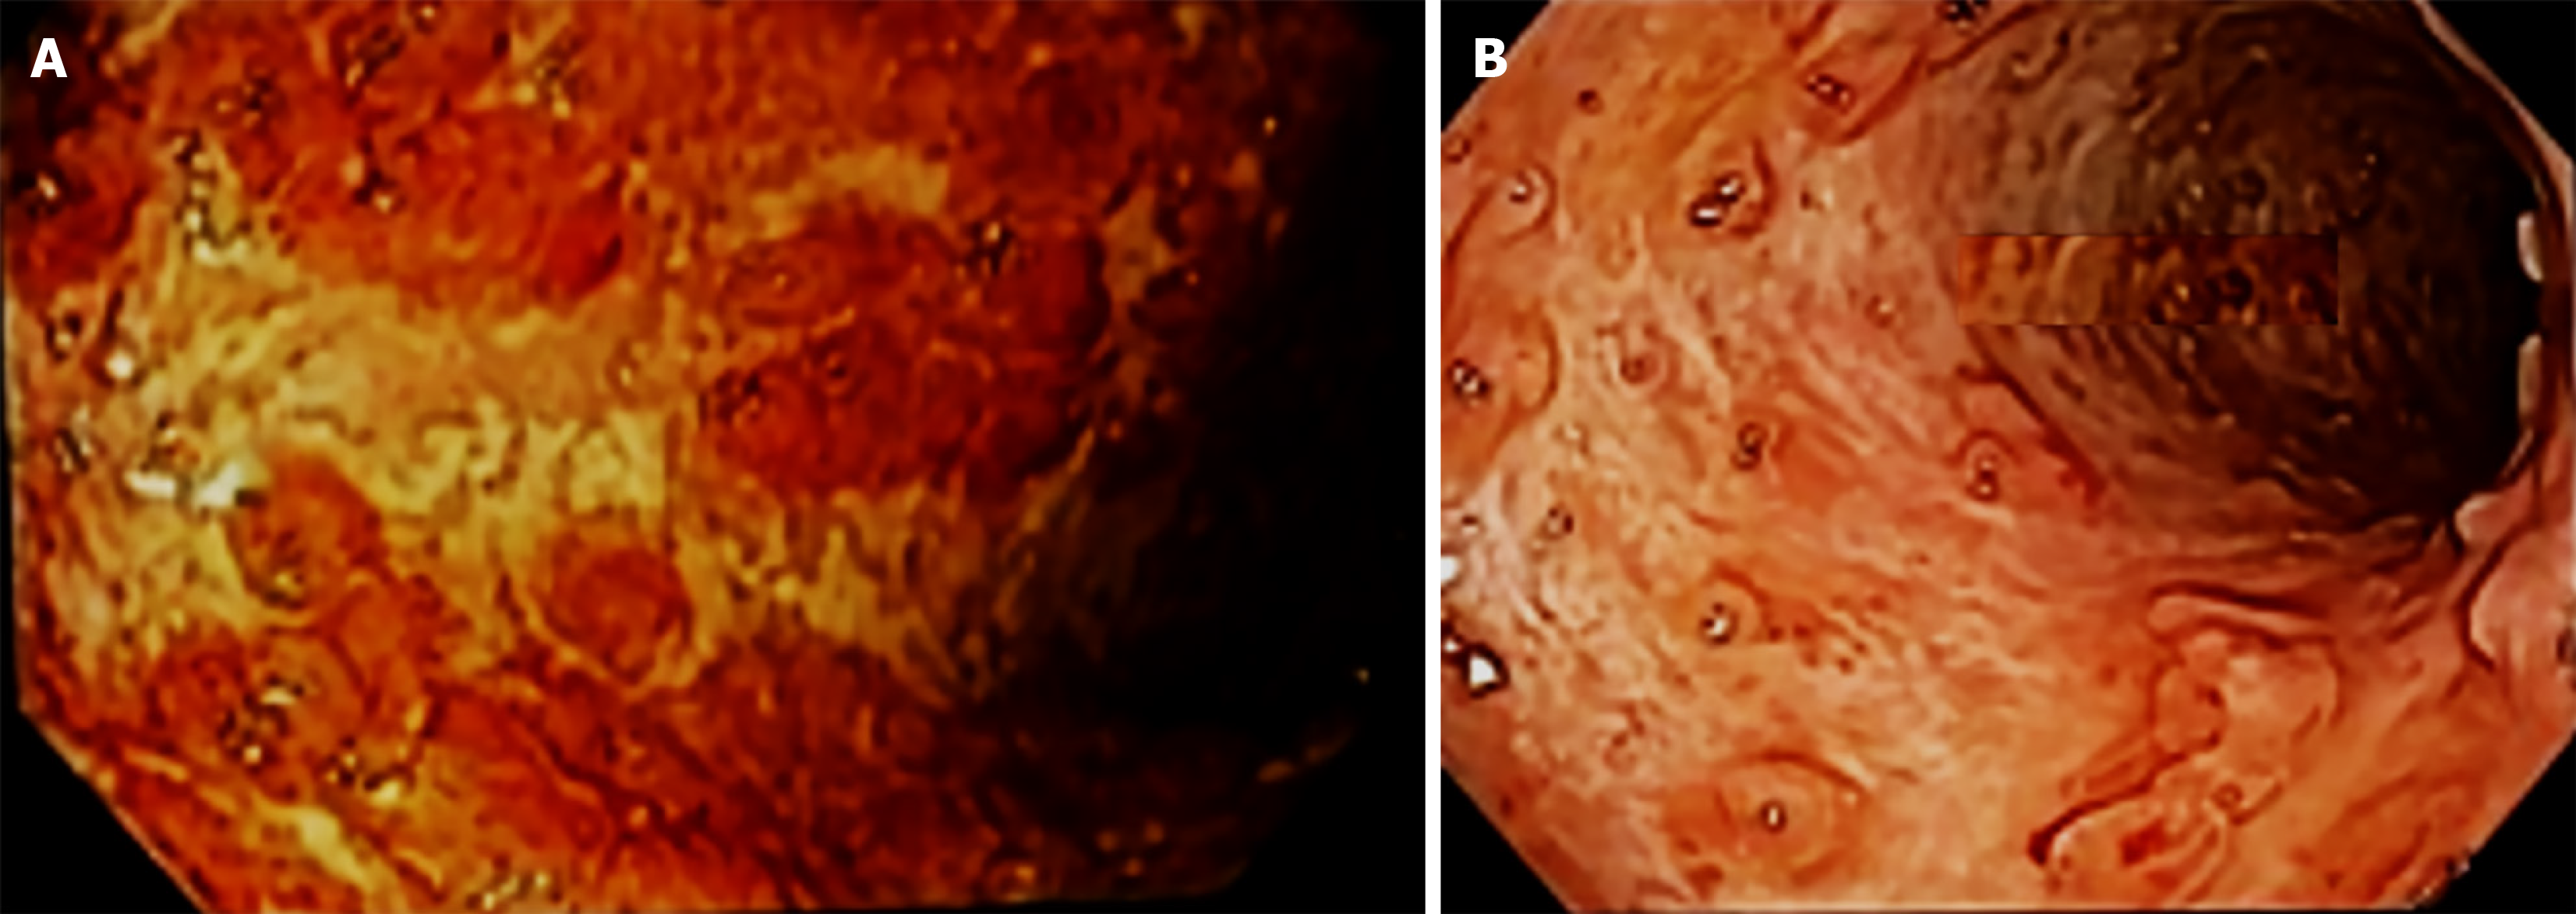
Figure 3 Treatment follow-up after adalimumab use.
A: Colonoscopy show intense proctocolitis; B: Remission, respectively.
- Citation: Mendonça JA, de Aquino JLB. Does ultrasound detect joint and intestinal changes in psoriatic arthritis and ulcerative colitis after immunobiological treatment: A case report. World J Radiol 2025; 17(8): 109146
- URL: https://www.wjgnet.com/1949-8470/full/v17/i8/109146.htm
- DOI: https://dx.doi.org/10.4329/wjr.v17.i8.109146


